Report Design
 Crystal Reports Forum : Crystal Reports 9 through 2022 : Report Design
Message Icon Topic: Stacked Bar Chart with lines Post Reply Post New Topic
Author Message
RenVilo
Newbie
Newbie
Avatar

Joined: 24 May 2011
Online Status: Offline
Posts: 24
Quote RenVilo Replybullet Topic: Stacked Bar Chart with lines
     Posted: 24 Oct 2012 at 12:30am
Hi guys,

ok so I have to create a stacked bar chart but I ran into some issues.

The report has to have the Date as the X axis and the amount as the Y axis but it also has to show you the value in a location. So it has to be like:
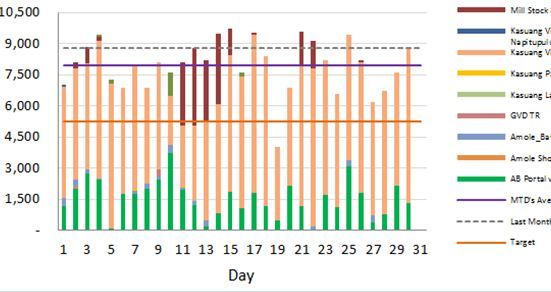


This is how my data looks like:


So you can see it's showing the day's in the month and stacking the location as per the value they did at that location. That part I can do.

The part I'm having issues with is adding 3 lines into the chart to show what the target was for that day, the actual from MTD and last month's actual. I know my SQL part is right but it's just the chart that's not working. Was thinking of making 2 charts and putting them over each other but I did read that's not the best way of doing it.

tx
IP IP Logged
hilfy
Admin Group
Admin Group
Avatar

Joined: 20 Nov 2006
Online Status: Offline
Posts: 3702
Quote hilfy Replybullet Posted: 24 Oct 2012 at 8:51am
It is possible to do this in Crystal by overlaying two charts and setting the background on the top one to be transparent.  However, there is no guarantee that the scales on both charts will ever be exactly the same.  If they're different, the combination becomes meaningless.
 
Having said that, I HAVE done this exact thing - stacked bar with a couple of lines - by creating the overlayed charts in Xcelsius.  In Xcelsius you can set the scale of both charts to be exactly the same base on the data you have.  Set up the data connection to be "Flash Variables".  You then export the visualization to a Flash (.swf) file and import it into your Crystal report and use the Xcelsius "helper" functions (ToXMLColumn(), ToXMLRow(), and ToXMLData()) to format your data and pass it in to the embedded visualization.
 
If you want more info about how to do this, I did a presentation on the subject at this years ASUG BO conference.  You can find the presentation and the sample files by looking for "Integrating SAP Dashboards into SAP Crystal Reports presentation" toward the bottom of the page on my website (www.dellstinnett.com/sample_code.html).
 
-Dell
IP IP Logged
RenVilo
Newbie
Newbie
Avatar

Joined: 24 May 2011
Online Status: Offline
Posts: 24
Quote RenVilo Replybullet Posted: 24 Oct 2012 at 10:36am
Thanks Hilfy but overlaying the one chart on the other will not work. Tried it and data does seem to stretch one a bit more then the other. Close but not 100%.

I can't use Xcelsius. We import our .rpt files into our software (developed in Australia) and just don't want to run. Not sure why but tried something similar before.

I know we have the CRCharts add-on but don't know it so will chat to my boss tomorrow and see if he knows of a way.
IP IP Logged
Printable version Printable version

Forum Jump
You cannot post new topics in this forum
You cannot reply to topics in this forum
You cannot delete your posts in this forum
You cannot edit your posts in this forum
You cannot create polls in this forum
You cannot vote in polls in this forum