Hi guys,
ok so I have to create a stacked bar chart but I ran into some issues.
The report has to have the Date as the X axis and the amount as the Y axis but it also has to show you the value in a location. So it has to be like:
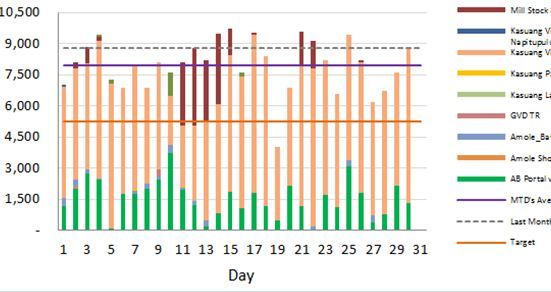
This is how my data looks like:

So you can see it's showing the day's in the month and stacking the location as per the value they did at that location. That part I can do.
The part I'm having issues with is adding 3 lines into the chart to show what the target was for that day, the actual from MTD and last month's actual. I know my SQL part is right but it's just the chart that's not working. Was thinking of making 2 charts and putting them over each other but I did read that's not the best way of doing it.
tx


 IP Logged