

Chapter 9 - Charting Data
Being able to visualize data can have a tremendous impact on the reader. Compared to just printing raw numerical data, adding a chart to a report makes it possible for readers to quickly grasp the important relationships between data. Many times reports are used with proposals to sell a reader on an idea or plan. Adding a colorful chart can sell your idea more effectively than a dry report filled with endless numbers. This chapter shows you what types of charts are available as well as how to modify their appearance so that they can make your report more appealing and quickly get your message across.
 Become a Crystal Reports expert with the authoritative resource available.
The tuturials and tips in this book will take your skills to the next level.
Become a Crystal Reports expert with the authoritative resource available.
The tuturials and tips in this book will take your skills to the next level.Buy at

This is an excerpt from the book Crystal Reports Encyclopedia.
Click to read more chapter excerpts.
Tutorial 9-1. Creating a Group Chart in the Page Header
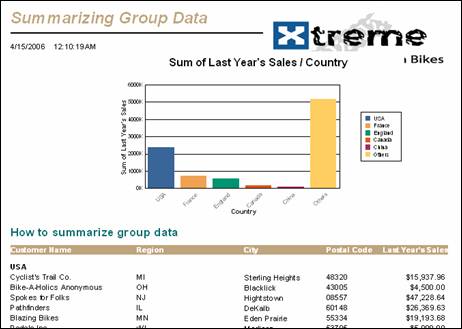
Let's take a report that uses groups and print a bar chart in the page header that summarizes each group's value. This gives the user a high-level overview of how each group compares to the other groups. The Crystal Reports sample report, Summary Group.rpt, groups sales data by country and shows sub-totals of last year's sales. We will add a chart in the header that shows each country and chart's last year's sales.
- Open the Crystal Reports sample report, Summary Group.rpt.
- Select the menu options File | Save As and enter the filename, Summary Group Chart.rpt.
- In Design mode, right-click on the chart and select the option Insert Chart. The chart's outline appears and it is attached to the mouse.
- Position the chart outline in the Page Header section and click the mouse button to place the chart. This also changes the height of the Page Header so that the chart can fit on it.
- Right-click on the chart and select the menu option Chart Expert. This opens the Chart Expert dialog box.
- On the Type tab, it should have defaulted to the Bar Chart type. If not, select it now.
- Click on the Data tab. The On Change Of option selects which data points are plotted on the chart. Crystal Reports has already selected Customer.Country by default. Leave it at this field.
- The Show option selects which values are plotted within the chart. Crystal Reports selected the field Count Of Customer Name. We want to show last year's sales instead. Click on the drop-down list and select the field Sum of Customer.Last Year's Sales.
- Click the Ok button to save the chart options.
- Click on the Preview tab and you should see the chart displayed in the report header. It should look similar to this:
To read all my books online, click here for the Crystal Reports ebooks.