

Chapter 1 - Introducing Crystal Reports
Learn what's new in Crystal Reports XI and the new Crystal Reports R2 release. The tutorial teaches you how to create your first report and understand the Report Expert dialog boxes. The Two-Pass Report Processing Model is explained in full detail so you understand the internal workings of Crystal Reports.
 Become a Crystal Reports expert with the authoritative resource available.
The tuturials and tips in this book will take your skills to the next level.
Become a Crystal Reports expert with the authoritative resource available.
The tuturials and tips in this book will take your skills to the next level.Buy at

Using the Wizard's Dialog Boxes
Each report wizard uses a combination of different dialog boxes to question you about how to build your report. Each wizard presents a slightly different combination of these tabs. This section describes how to use each dialog and explains any aspects of it that may not be obvious. The report wizard dialogs are called Data, Links, Fields, Grouping, Summaries, Group Sorting, Chart, Record Selection, Template, Drill and Mailing Labels.
The Data Dialog
The Data dialog is the first dialog box presented. It lets you select the database and tables that store your data. The database can be a standard data source such as SQL Server or a non-standard data source such as an Excel spreadsheet.
Figure 1-9. The Data dialog of the report wizards.
The Links Dialog
Reports that use two or more tables need to have the tables linked so that data can be pulled from both of them. The Links dialog lets you set the fields for creating relationships between the tables. Crystal Reports attempts to automatically link the tables together. If two fields have the same name and the data types are compatible, then Crystal will link them using this field.
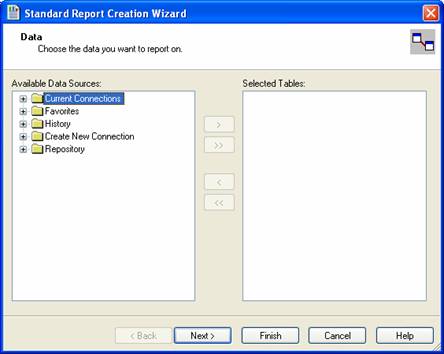
Figure 1-10. The Links dialog of the report wizards.
The Fields Dialog
After selecting which tables you want to use for your report, the Fields dialog allows you to select which fields will be shown. Adding and deleting fields is done in the standard manner of dragging and dropping them between windows or selecting a field and clicking on the appropriate arrow button.
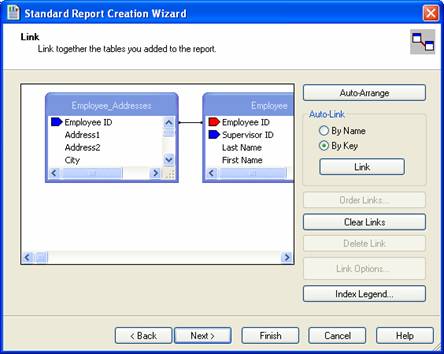
Figure 1-11. The Fields dialog of the report wizards.
After you add all the necessary fields to your report, you are free to reorder them by using the arrow buttons above the window. The order that the fields are listed in is the order in which they are shown on the report. Select the field to move and click the up or down arrow to reposition it.
The Grouping Dialog
Some reports have so much data that they can be a little hard to understand. When reports are dozens or even hundreds of pages long, you need to organize the information in a way that makes it easier to absorb the data in smaller pieces. You do this by creating groups within the report. Groups can be based on many things. Some examples are grouping on months of the year or the names of the different branch offices for a company.
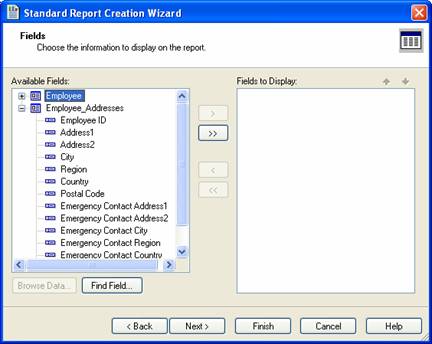
Figure 1-12. The Groups dialog of the Report Wizard.
The Summaries Dialog
It is very common for reports to calculate sub-totals and other summary calculations on the numeric fields. The Total tab, shown in Figure 1-13, is where you define the summary calculations for the different fields. The left listbox shows all the available fields. The right listbox shows the fields that will have summary functions calculated for them.
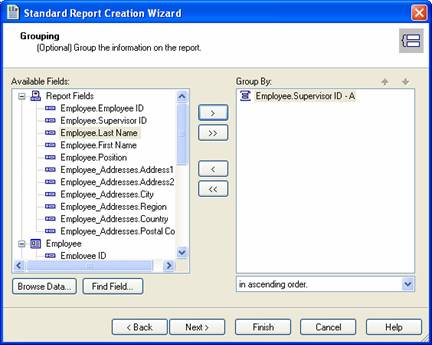
Figure 1-13. The Total dialog of the Report Wizard.
The Group Sorting Dialog
When adding a group to a report, you probably assume that every record within the group will be displayed. In most circumstances, this is the case. However, you can tell Crystal Reports to only display a certain number of records based upon their rank. For example, you could have a top salesperson report, where you show the top 10 salespeople in your office. You could also have another report that shows the worst 10 salespeople. The Group Sorting dialog lets you do this by sorting the groups based on a summary field.
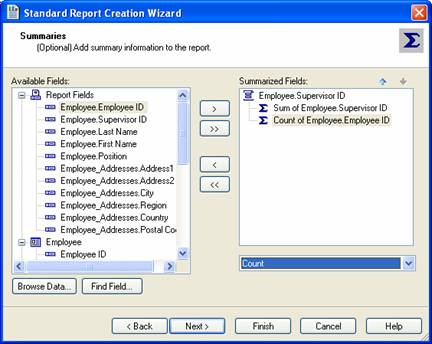
Figure 1-14. The Top N dialog from the Report Wizard.
The Chart Dialog
This dialog lets you add a chart to your report. You can also set a variety of options for what type of chart to display and how to display it.
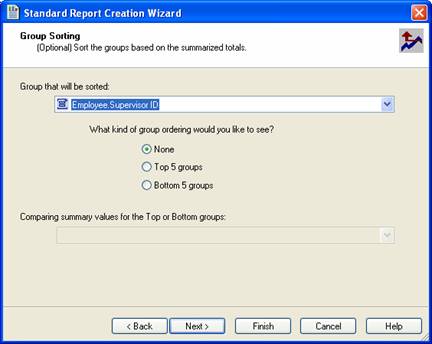
Figure 1-15. The Chart dialog from the Report Wizard.
The Record Selection Dialog
Some reports need to only show a sub-set of all the data that is in a table. For example, a financial report may only show the corporate data for a single quarter or a range of quarters. To filter out certain data so that you limit how much information is shown on a report, use the Record Selection dialog shown in Figure 1-16.
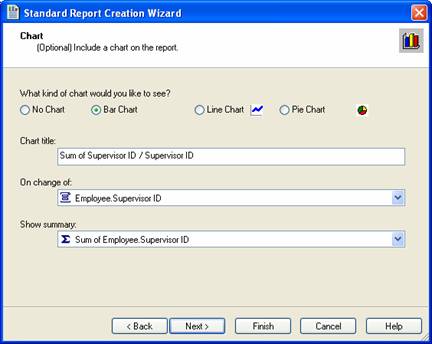
Figure 1-16. The Select dialog from the Report Wizard.
The Template Dialog
After specifying the report details, use the Template dialog to format everything so that the report has a professional look to it. This dialog, shown in Figure 1-17, lists over a dozen different pre-determined templates that can be applied to your report. These templates make it easy for you to take some raw data and spice it up enough to make everyone think you worked really hard to create the report!
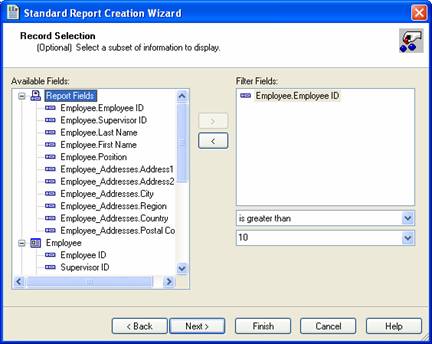
Figure 1-17. The Style dialog from the Report Wizard.
The Cross-Tab and Customize Style Dialog
The Cross-Tab and Customize Style dialogs are only available when using the Cross-Tab Wizard. They let you modify the cross-tab data for what appears in the rows and columns. Modifying these tabs is very involved and is explained in detail in Chapter 12.
The Drill Dialog
The Drill dialog is only available when using the Drill-Down Wizard. When creating drill-down reports, you allow the user to see a summarized view of their data. If they want to examine the data in more detail, they can expand a record to see more detail relating to the summarized information. The summarized fields are listed on this tab. When you click on the field's name, it will toggle back and forth between "Show" and "Hide". This will alternate the default of whether it gets displayed or not.
The Mailing Labels Dialog
The Mailing Labels wizard is very simple. After selecting the database tables and fields that are displayed, it lets you select the label size. You can choose from a list of the standard Avery labels or choose a User Defined Label.
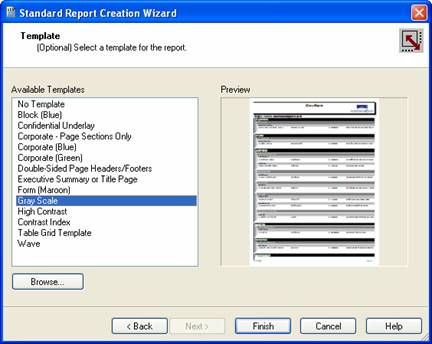
Figure 1-18. Mailing Labels dialog of the Report Wizard
In the middle of the dialog box are the various settings of how the labels are sized and the gaps between each label. At the bottom, you select whether you want the labels to go across the page or down the page in a column. The bottom right corner gives you a general idea of whether you entered the parameters properly by calculating how many labels are printed per page.
1 Crystal Reports Encyclopedia Volume 2, .NET 2005 will be released in Spring 2006.
2 To change the Regional settings, open the Control Panel and select Regional and Language Settings option.
To read all my books online, click here for the Crystal Reports ebooks.