Introducing Crystal Reports
Visual Studio .NET is the first Windows development environment that gives developers a fully integrated and robust reporting solution. Crystal Reports is now installed with Visual Studio so developers can write applications that have reports seamlessly integrated into them. (Perhaps make this next sentence a footnote?)Starting with Visual Basic 3.0, Crystal Reports was included with the language, but not part of the default installation. It was also a stand-alone product that was independent of the programming language.
Over the years Microsoft has been including Crystal Reports with each version of Visual Basic. With version 6 they even wrote a Data Report component that was supposed to be a replacement for Crystal Reports. But it failed miserably.
With the release of Visual Studio.NET, Microsoft finally woke up to the needs of developers. They licensed Crystal Decisions to write a version of Crystal Reports to be the default reporting solution installed with .NET. Built into the IDE, Windows developers now have the tools to write presentation-quality interactive reports.
Creating Your First Report
Before you learn about all the features of Crystal Reports, it is best to start by creating a quick report. Open Visual Studio and create a new project. This can be either VB.NET or C#, and it can be either a Windows Application or ASP.NET. Designing reports with Crystal Reports is independent of the application type. The following steps are the same for both types of applications.
Once the project is open, select Project | Add New Item. This displays the list of available templates. Scroll down near the bottom and select the Crystal Report template. Enter the name "Employee List". Figure 1-1 shows this dialog box for a Windows Application. Click Open to create the report.

Figure 1-1. The Add New Item dialog box.
When the Crystal Report Gallery dialog box appears, accept the defaults of "Use Report Expert" and "Standard Report". This opens the Standard Report Expert shown in Figure 1-2.

Figure 1-2. The Standard Report Expert dialog box.
The first tab shown is the Data tab. Select the Xtreme Sample Database (it comes with Crystal Reports) by clicking on the OLE DB(ADO) option in the Available Data Sources list. This brings up a new dialog box. Select Microsoft Jet 4.0 OLE DB Provider. On the next dialog box enter the database name (database name is the fully qualified file path). By default it is located at C:\Program Files\Microsoft Visual Studio .NET\Crystal Reports\Samples\Database. Select Finish.
You are back at the Data tab of the expert. Click on the Tables node to expand and double-click on the Employee table name (or drag and drop it) to move it to the window titled "Tables In Report". Click Next.
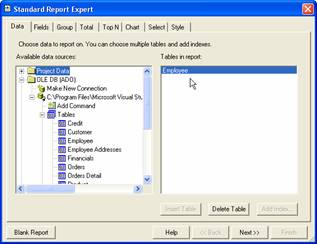
Figure 1-3. The Data tab of the report expert.
To display fields on the report, you have to select them at the Fields tab. Double click on the following fields to add them to the right window: Employee Id, Last Name, and Hire Date. This is shown in Figure 1-4.
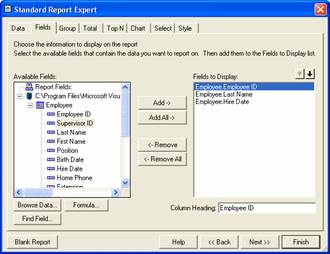
Figure 1-4. The Fields tab of the report expert.
At this point you could continue with the report expert to do things such as grouping and selecting which records to print. But for this simple example, ignore those tabs and click on the Style tab. Enter the title "Employee List" and keep the default style of Standard. Click Finish.
The report expert closes and builds a fully functioning report that is ready to run (Figure 1-5). If this report were to be used in a real application, the next step would be to modify the form so that it can preview and print the report.
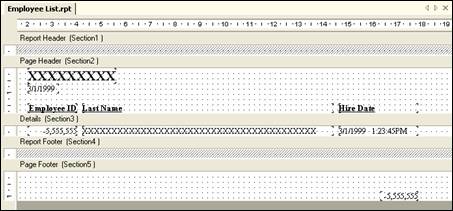
Figure 1-5. Employee List report file.
Previewing Reports with a Windows Form
After creating the Employee List report in the previous section, you can preview it using either a Windows Form or and ASP.NET application. This section shows you how to preview it from a Windows Form. ASP.NET is covered in the next section.
Previewing the report requires modifying the form. When you created the new project, Form1 should have been automatically added to the project for you. Open Form1 in design mode and add a CrystalReportViewer control to it. This is normally listed as the last component in the Windows Forms section of the Toolbox. Resize the viewer so that it fills up the entire form. Do this by finding its Dock property and clicking on the drop-down box. Click on the middle square so that the property is set to Fill.
The viewer control has many ways to preview reports. This example uses the ReportDocument component because it is the easiest of the choices. Add the ReportDocument component to the form by double-clicking on it from the Componets section of the Toolbox. A Choose a ReportDocument dialog box automatically appears, allowing you to select which report to display. The dropdown control lists all the reports that are part of your project. For this example, it only shows the Employee List report.
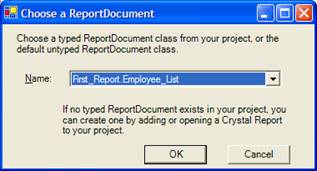
Figure 1-6. The ReportDocument dialog box.
Select the Employee List report and click the OK button. This adds the ReportDocument component to your form.
You have to tell the viewer that the report it is going to preview is in the ReportDocument component. Look at the Properties Window and find the ReportSource property. It has a dropdown control which lists the ReportDocument components on the form. In this example, the Employee List will be the only one listed. Click on the Employee_List component to select it.
Run the application. When the form loads it automatically instantiates the Employee List report object and display it using the viewer. Print it by clicking on the printer button in the menu bar. The preview of the Employee List report is shown in Figure 1-7.
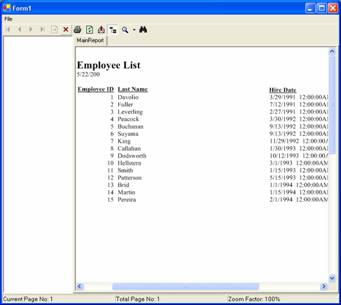
Figure 1-7. Employee List report output in preview mode.
You can see that this quick report isn't perfect. The Hire Date column shows times as always being 12:00:00 AM and the Group Tree is visible even though there aren't any groups in the report. As is usually the case, the report expert gives you a good basis for writing a report, but you still need to make some changes to clean it up.
Previewing a report with ASP.NET requires adding a CrystalReportViewer control to the web page and setting its data bindings. Open the default web page in design mode and add a viewer control to it. The viewer is located near the end of the Toolbox under the Web Forms tab. Once you add it to the form you will see a medium sized rectangle on the web page.
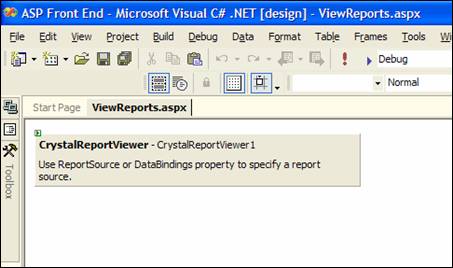
Figure 1-7. The ASP.NET report viewer control.
Notice that the web viewer control looks totally different than the Windows viewer control. The web viewer is simply a placeholder for where the report will be displayed.
Add a ReportDocument component to the web page by double-clicking on the ReportDocument component. The ReportDocument component is listed in the Components section of the Toolbox. As mention in the previous section, when you add a ReportDocument component to your form, it automatically displays the Choose a ReportDocument dialog box. This lets you select which report will be displayed. The dropdown control lists all the reports that are part of your project. For this example, it will only show the Employee List report.
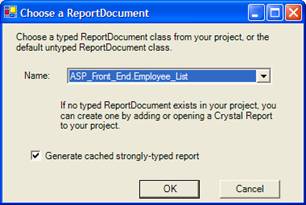
Figure 1-8. The ReportDocument dialog box.
Select the Employee List report and click the OK button. This adds the ReportDocument component to your form.
You have to associate the ReportDocument component with the viewer control so that the viewer knows which report to display. Look at the viewer's properties and at the very top is the DataBindings property. Click on it and then click on the ellipses button to open the DataBindings dialog box.
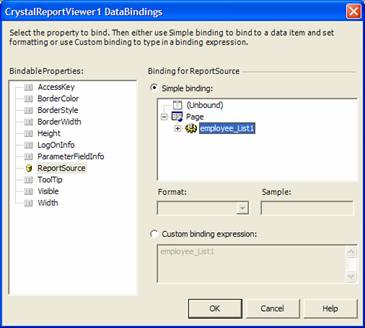
Figure 1-x. The DataBindings dialog box.
Click on the ReportSource property listed on the left. Expand the Page item in the Simple Binding window. It shows you the reports that were added to the page using the ReportDocument components. In this example, only the Employee List report is shown.
Click on the Employee List report item and click the OK button. A preview of the report is immediately displayed. Unlike Windows development, the viewer control shows you what the report looks like while you are in design mode. This a great feature for web developers!
At this point, you've performed all the same steps that were shown during the previous example for previewing with a Windows application. However, if you ran your ASP.NET application now, the report wouldn't be shown. To make the report display on the web page you have to call its DataBind() method. Do this in the Page_Load() event.
Private Sub Page_Load(ByVal sender As System.Object, ByVal e As System.EventArgs) Handles MyBase.Load
'Put user code to initialize the page here
CrystalReportViewer1.DataBind()
End Sub
After typing in this code, run the web application and you'll see the Employee List report automatically previewed when the page opens.
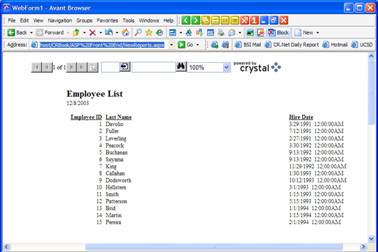
Figure 1-9. The Employee List report shown in an ASP.NET application.
Examining the Report Designer
Each report within your application is just like any other component that your application uses. It is listed in the Solution Explorer window as a class in your project. When you double-click it, it opens the report in design mode and you can make changes to it.
Each report starts with five sections: Report Header, Page Header, Detail, Page Footer, and Report Footer. These sections are described in Table 1-1.
Table 1-1. Report sections.
| Section | Description |
|---|
| Report Header | Appears at the top of the first page of the report. |
| Page Header | Appears after the Report Header on the first page. On all the remaining pages it appears at the top of the page. |
| Group Header | Appears at the beginning of each new group. |
| Details | The row that displays the record information. There is usually one detail row for every record in the table. |
| Group Footer | Appears after all records of a group have been printed. |
| Page Footer | Appears at the bottom of each page. |
| Report Footer | Appears as the bottom of the page for the last page in the report. |
To the left of the report layout is the Toolbox as shown in Figure 1-7. When you have the report designer open, there are only a few controls available in the Toolbox. They are the Text Object, Line Object, and Box Object. These are the most basic of the controls available.
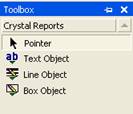
Figure 1-10. Crystal Report's toolbox.
Oddly enough, there are more controls that can be used on a report, but they aren't listed in the toolbox. You have to right-click on the report and select the Insert menu option. This menu is shown in Figure 1-8. There are ten controls on it that can be added to a report as well as a lot of special fields that display report specific information (e.g. page number, print date, etc.). These controls are described in Chapter 2.
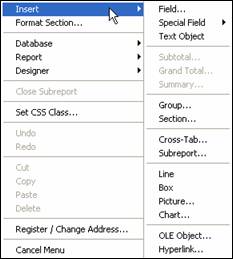
Figure 1-11. Crystal Report's Insert menu.
In the bottom right hand corner of the IDE is the Properties window. As expected, these properties are only applicable for the control that has the focus.
The CrystalReportViewer Control
The CrystalReportViewer control is used on a form to display a report. You have to use this control when you want to preview and print a report. It is found in the form's Toolbox as the last control listed. To access it, you have to use the down arrow to scroll down to it.
The CrystalReportViewer control is fully customizable. Since it is the only way to display a report in your application, you may need to customize it for some applications. You don't want a user to feel like they are looking at a third-party control when using your application. Each of the buttons can turned on or off in design mode or during runtime. You can also add your own buttons to a form and have them manipulate the report layout and respond to user events. This is described in Chapter 2.
Two-Pass Report Processing
Crystal Reports processes reports in two stages. This is called the Two-Pass Report Processing Model. The first pass creates the primary data to be printed. During the second pass this data is further processed to finalize it for printing.
The first pass is used to read individual records one at a time and calculate any formulas that use them. This pass will only calculate the formulas that are based on raw data within a record or that perform simple calculations. As each record is read and the formulas are calculated, the results are stored in a temporary file to be used during the second pass.
After the first pass is finished, Crystal Reports performs a second pass where it evaluates all summary functions on the data. This wasn't possible during the first pass because all the data had not been read yet. During the second pass all the raw data has been read into the temporary file and it can be evaluated and summarized as a whole.
Understanding the type of data that is processed during the Two-Pass Processing Model is essential to being able to write formulas and summarize data. Different chapters throughout this book reference this model for explaining when you can and can't use certain reporting functionality.
