Chapter 10 - Creating Cross-Tab Reports
Cross-tab reports are a powerful way to create summaries of data in a spreadsheet style format. They generate summary data in a grid where the rows and columns represent groups of data. This provides the user with a report format that is easy to read and uses a small footprint on the page. After this chapter you should have a good understanding of how to use cross-tab reports and you'll also get some practice with creating them.
 Become a Crystal Reports expert with the authoritative resource available.
The tuturials and tips in this book will take your skills to the next level.
Become a Crystal Reports expert with the authoritative resource available.
The tuturials and tips in this book will take your skills to the next level.Buy at

Understanding Cross-Tab Reports
Cross-tab reports format groups of data into an easy to read grid format. This grid format is very similar to the way a spreadsheet represents data. It lets the user visually analyze the data in a way that makes it easy to compare values in one group against the values in another group. Before we see what a cross-tab report looks like, let's look at a typical report that summarizes data within groups. After looking at Figure 10-1, we'll see it reformatted as a cross-tab report.
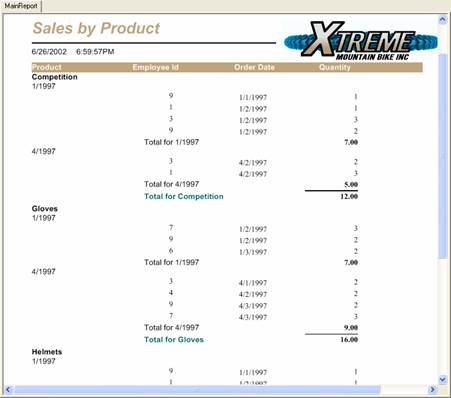
Figure 10-1. Grouping by Product and Quarter.
This report has two grouping fields. The outermost group is by Product Type and the innermost group is the Order Date grouped quarterly. The group header for the Order Date is the first date in the period. The detail records show you the Employee Id, Order Date, and Quantity. There are two sub-totals of the quantity. The first occurs on the change of quarter and the next is on the change of product type.This is a pretty standard grouping report and it shares a common problem with other grouping reports: the sub-total amounts are spread out across multiple pages. This makes it hard to compare numbers because they aren't consolidated into a single page.1 A user reading this report will find that they are continuously flipping pages to see how the sales of one product compare to the sales of another product.
Re-writing this report as a cross-tab report eliminates this problem. Figure 10-2 shows the same report in cross-tab format.
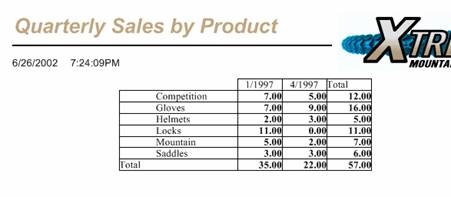
Figure 10-2. Cross-tab report by Product and Quarter.
The cross-tab is much easier on the eyes. The outermost group field on the original report, Product Type, is represented on each row of the grid. The two columns represent the innermost group field, Order Date grouped by quarter. These columns span horizontally along the page. Although the original report has many detail records, these are ignored when generating the rows and columns of the crosstab. Only the values of the grouping fields are listed. This cross-tab report took two grouping fields and made them the X-axis and Y-axis of the grid.
To read all my books online, click here for the Crystal Reports ebooks.