4
Filtering Crystal Reports Data with Parameters
The previous chapter showed you how to make reports easier to read by sorting and grouping the data. This made it possible to break down large amounts of data into smaller and easier to understand groups. Another way to make it easier to understand reports is by filtering out unnecessary data prior to printing the report. Filtering data lets you customize the report to the user’s preferences so that only information specific to their needs is shown.
Filtering data consists of two levels. The first level uses the Select Expert to specify which data to print on the report and which data should be filtered out. But the Select Expert by itself only creates a static selection formula. It doesn’t take into account the user’s preferences. So the second level builds upon the Select Expert by creating parameters that query there user for the specific data they need. These preferences are used within the selection formula so that the report is customized to the user’s needs.
This chapter first shows you how to filter data using the Select Expert and then shows you how to use parameters to customize the filters. Parameters are also used within report formulas and for custom formatting. These topics are also illustrated. The effective use of parameters within record selection formulas and custom formatting will let you create dynamic reports that are tailored to each specific user.
Selecting Records
Prior to this chapter the reports have selected records from a table without regard to selecting specific data. It was assumed that you wanted to display every record in the table. While this is true some of the time, it is more the exception than the rule. You frequently need to filter the data so that only a subset of records gets printed.
Here are a few examples of reports that select data for a specific purpose:
· A sales report shows the sales figures for a specific region or sales person. Another shows data for a specific month and groups it by sales person.
· A user is prompted to enter their User Id and Password and a payroll report uses their security level to determine what salary information should be printed.
· An Inventory Alert report shows products whose inventories are below the required minimum level. The purchasing department uses this report to order products that are at risk of going out of stock.
Crystal Reports makes selecting records easy. It provides a Select Expert that lets you pick one or more fields and set a selection formula for each field. Each record in the database is evaluated with the selection formula and this determines whether it appears on the report or not. The Select Expert dialog box is similar to other Crystal Report experts and is easy to learn.
Using the Select Expert
To open the Select Expert, select the menu items Report | Select Expert. The other method is clicking on the Select Expert button on the Toolbar.
![]()
If this is the first time the Select Expert has been run for the report, it shows the Choose Field dialog box. As you can see in Figure 4-1, it simply lists all the fields available. The fields already used on the report are shown first and they are followed by every available field from the report’s data source. A field from either of these groups can be selected

Figure 4-1. The Choose Field dialog box.
Once you select a field from this dialog box and click the OK button, the dialog box is not shown again. Instead, you are always taken to the Select Expert dialog box shown in Figure 4-2.
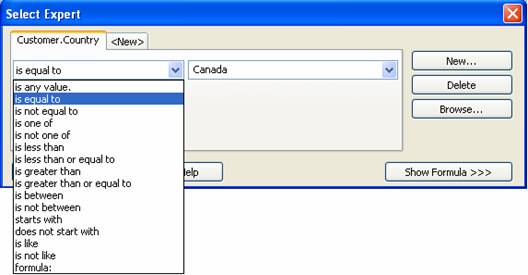
Figure 4-2. The Select Expert dialog box.
There are two tabs in the Select Expert dialog box. The first is titled with the field that was just selected in the Choose Field dialog box and the second is titled <New>. The tab with the field name has a dropdown box for selecting the filter criteria. This is set to is any value. By default, reports don't have any filters turned on and every record gets selected. Click the dropdown box to view available filtering options and select the one you want. The dialog box in Figure 4-2 shows all the options in this dropdown box. This list is the textual equivalent of the basic comparison operators. They are described in detail in Table 4-1.
|
Criteria |
Description |
|
Is Any Value |
Every record is selected. This is the same as not
specifying a record selection formula. |
|
Is Equal To |
The field must exactly match a specified value. |
|
Is Not Equal To |
All records where the field does not match the specified
value are selected. |
|
Is One Of |
Lets you build a list of acceptable values. As long as the
field’s value matches any one of the values in the list then the record is
selected. |
|
Is Not One Of |
Similar to Is One Of except that the record is selected if
the field’s value doesn’t match any of the values in the list. |
|
Is Less Than |
The value must be less than the value specified. |
|
Is Less Than or Equal To |
The value must be equal to or less than the value
specified. |
|
Is Greater Than |
The value must be greater than the value specified. |
|
Is Greater Than or Equal To |
The value must be equal or greater than the value
specified. |
|
Is Between |
You specify a range of values and the field’s value must
be within this range. It can also be equal to the endpoints of the range. For
example, if the start and end points are 100 and 200, then the following
values would be acceptable: 100, 101, 199, 200. |
|
Is Not Between |
The value must be outside the range. For example, if the
start and end points are 100 and 200, then the following values would be
acceptable: 1, 99 and 201. |
|
Starts With |
Selects string fields that start with one or more
characters. For example, a value of “B” would match the names “Brian” and
“Barry”. |
|
Does Not Start With |
Selects string field that do not start with the characters
specified. For example, a value of “B” would match the names “Lynn” and
“Karen” because they do not start with the letter “B”. |
|
Is Like |
Let’s you use wildcards for specifying the matching
criteria. Using wildcards is discussed more later in the chapter. |
|
Is Not Like |
The opposite of Is Like. |
|
Formula: |
Lets you type in the formula directly. Useful when the
formula is too complex for the available criteria. |
Table 4-1. The Select Expert selection options.
Using a Boolean field gives you two new criteria: Is True and Is False. These criteria do exactly what they imply. They select records where the field is either True or it is False.
Selecting a DateTime field gives you two additional options listed with the comparison operators. These options let you select dates based on sophisticated date ranges. For example, you can select fields that fall within the last 7 days or select fields that are in the first quarter of the calendar year.[1] See Figure 4-bb for a list of the available functions.
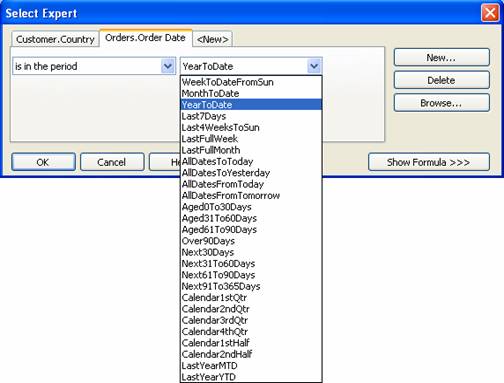
Figure 4-bb. Available date range functions.
After selecting a comparison method, the right side of the dialog box changes so that you can enter the value to compare the field to. With the majority of the comparisons, only a single dropdown box is shown. For example, comparisons such as Is Equal To or Is Greater Than compare the field to a single value.
There are exceptions to the rule of only having a single dropdown box.. The is between and is not between comparisons give you two dropdown boxes. This lets you create a range of values by entering beginning and ending values. The is between comparison is inclusive. The is not between comparison is exclusive. As mentioned in Table 4-1, if the range is from 100 to 200 then the numbers that would be included in this range start at 100 and go up to, and including, 200. If the criteria was is not between then the valid numbers would be any number less than 100 or greater than 200.
A very helpful feature is that all the current values for the field are listed in the dropdown box. Clicking on the arrow reveals a list of all the possible values that the field can have because Crystal Reports queries the database and populates the list with the current data for that field. In fact, you will probably notice a short delay as it opens the database and reads in the records. You can either select one of these values from the list or type in a new value that isn’t in the list.
Caution
If the report uses a connection to the database on the server, make sure you have an active connection to it. Otherwise Crystal Reports temporarily freezes up while it attempts to connect to the server and wait for a response.
The comparisons is one of and is not one of also let you enter more than just a single value to compare to. These criteria let you build a list of items where the field should either be in the list or not in the list. As you select items from the dropdown box, they are added to the listbox below it. This dialog box is shown in Figure 6-3.

Figure 6-3. Building a list of items.
You can also type in values manually and adding it to the list by clicking on the Add button. If you add an item by mistake, delete it from the list by clicking the Remove button.
You are not limited to selecting records based on a single field. The <New> tab lets you select additional fields for record selection. Clicking on this tab shows the same Choose Field dialog box that you saw when you first opened the Select Expert. After selecting a field you are brought back to this tab and that field is now in the tab header. The rest of the selection process is the same as what was just discussed. You can add as many fields as you want.
When you have more than one field in the Select Expert, Crystal Reports examines each field separately to see if it matches the criteria specified. After making each comparison it only selects the record if it matches every condition. If there a four fields listed in the Select Expert and a record only matched three of them, then it wouldn’t be selected. This referred to as a Boolean AND comparison.
Filtering with Wildcards
The two comparisons Is Like and Is Not Like have two characteristics which require more explanation. The first characteristic is that it lets you build a list of allowable criteria. Just like the comparisons is one of and is not one of described previously, as long as a field’s value matches any one of the values in the list, then the record is printed.
The second unique characteristic is that you can use wildcard characters to create a search string. Wildcards let you create a pattern that strings have to match. Using a search pattern lets a group of strings match the selection criteria.
There are two wildcard characters you can use: ? and *. The ? allows any character to be in that position in the string. For example, let’s say that you want to print a report with all employees with the first name of Brian. You know that Brian is commonly spelled with a “y” as well as with an “i” and you want to find both spellings. The filter “Br?an” would match both spellings. The ? in the third position tells Crystal Reports that you don’t care which letter is used there as long as the rest of the string matches exactly.
Another example of using the ? wildcard is to generate a report showing records where there is a typo in the social security number. Sometimes people mistakenly skips a number when typing in the SSN or they forget to include the dashes. Using a criteria of is not like and setting the filter to ???-??-???? tells Crystal Reports which characters should have a number in them and which ones can only be the dash. Any fields that don’t match this filter string exactly will be listed on the report.
The second wildcard character is the *. It matches any number of characters in the string. This is best used when you want to find values that start a certain way. For example, if you want to find all the names start with the letter C then you would use a filter string of C*.
Introducing the Formula Editor
The Select Expert is a very helpful tool for selecting one or more fields using the basic comparison operators. This is probably adequate for many of the reports you write, but what about the reports where you need to build more complex filtering criteria? For those reports, there is the Formula Editor. The Formula Editor is described in complete detail in Chapter X, but here is a summary of how to use it.
The Formula Editor lets you
use
Caution
When opening the Formula
Editor from within the Select Expert, you are only given the option of using
There are two ways to enter a custom formula. The first way is to click on the Show Formula button. This shows the existing formula built using the fields already selected. You can change this formula directly so that it matches the selection criteria you need. If you can't remember the different built-in functions well enough to type them in directly, click on the Formula Editor button. This brings up the Formula Editor dialog box (discussed in Chapter X) and you can use it as a reference tool to build the formula. The second way to enter a formula is to click on the comparison list dropdown box and at the very bottom is an item called formula:. Clicking on this item changes the right side to a multi-line text box that lets you type a formula from scratch.
Selecting Records for Grouping
Selecting records based on grouping data is slightly different than what you’ve seen so far. When selecting records based on data at the grouping level you have to use summary functions. For example, a report prints the individual product sales and groups the data by customer. In the group footer it prints the total sales for each customer. To show all the customers that have a minimum purchase level you have to use the Sum() function in the select expert. Otherwise it will use the individual purchase records to perform the comparison and the results won’t be accurate.
It’s easy to create a filter based on grouping data. When selecting the field to filter on, in the Choose Field dialog box look at the end of the list of the report fields. The grouping fields are listed last and they are identified by their group number and the summary function.
It’s helpful to realize how filtering on grouping data is different than filtering on database fields. As mentioned in Chapter X, Crystal Reports uses a multi-pass system of processing data. In the first pass the raw records are processed and summarized. This is the point where the non-grouping selection formulas are used to filter out the raw data. In this stage not all the records have been read yet so none of the summary calculations are known yet. Thus, filtering data based on these calculations can’t be performed yet. It is in the second pass that all the summary calculations have been performed and their totals are known. This is where the selection formulas based on summary data are used to filter out groups of records.
Tutorial 4-1. Selecting Records
Let’s put what we learned about selecting records to
use. In this tutorial we will filter on two fields: the Country and Last Year’s
Sales. For Country we want to select a specific set of countries to print (
1. Open the Crystal Reports sample report Group.rpt. This report demonstrates grouping data on the Country and Customer Name fields. It shows the previous year’s sales by customer and their percentage of the total sales.
2. Save the report as “Select Expert Tutorial.rpt”.
3. Click the menu items Report | Select Expert.
4. The Choose Field dialog box opens for you to select the field to filter on. Select the Customer.Country field.
5. The Select Expert dialog box opens with the Customer.Country tab shown. For the comparison, select Is One Of from the dropdown box.
6.
In the second dropdown box, select each of the
following values:
7. Click on the <New> tab and select the field Customer.Last Year’s Sales. Click the Ok button to go back to the Select Expert dialog box.
8. For this field we want all sales that are greater than $25,000. For the condition select Is Greater Than or Equal To.
9. In the second dropdown box type in $25,000.
10.
To make sure you’ve entered both
conditions properly, click on the Show Formula button in the bottom right hand
corner. Compare your formula to the following:
{Customer.Country} in
["
{Customer.Last Year's Sales} >= $25000.00
11.
Make any necessary corrections to your formula if you
have a mistake.
12.
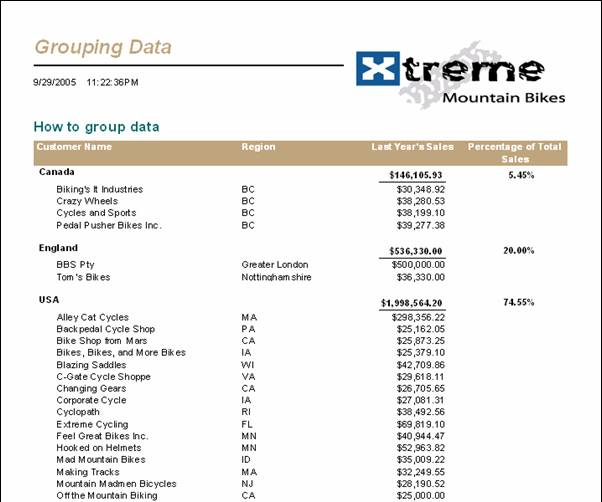
Preview the report and it should look like the
following. Notice that each sales amount is greater than $25,000.
Tutorial 4.2. Selecting Records by Grouping Data
Let’s modify the previous report so that it shows the details for all countries that had last year total sales greater than $100,000. This requires deleting the two previous fields from the record selection and adding total of last year’s sales.
1. Open the report from the previous example, “Select Expert Tutorial.rpt”. Save it as “Grouping Tutorial.rpt”.
2. Select the menu items Report | Select Expert. This opens the Select Expert with the two fields already shown.
3. Click on the Delete button twice to remove the two existing fields.
4. Click on the <New> tab to open the Choose Field dialog box.
5. In this example we don’t want to simply select the field Customer.Last Years Sales because this field is at the record source level. We want to filter the records based on the total of Last Year’s Sales for the entire Country group. This is listed near the end of the fields list as Group #1: Customer.Country – A: Sum of Customer.Last Years Sales. Select this field and click on the Ok button.
6. For the comparison select Is Greater Than and enter a value of $100,000.
7. Click on the Show Formula button to see the formula’s text. Notice that the radio button Group Selection is selected. Crystal Reports recognized that your record selection formula is using a summary field and consequently flagged it as a Group Selection formula. This is automatic and you don’t have to worry about doing it manually.
8. Click the Ok button to save the changes. Preview the report and you’ll see that quite a few countries had sales over $100,000 and the report is seven pages long.
Using Parameters
The first part of this chapter showed how filtering data lets you customize a report to fit a specific user’s needs. The only drawback to this approach is that you have to know in advance what that user’s needs are when you are designing the report. Since the filter has to be changed via the Select Expert, you either have to save a separate copy of the report for each variation or the user needs to know how to customize the report themselves. Neither of these options is the most practical approach. A much better solution is to create a filter that uses parameters to prompt the user for their input prior to printing.
In their most basic form, report parameters are simply a means of asking the user questions about what they want printed. When the user opens the report he or she is prompted with each question and the answers are used to carry it out. Some examples of typical questions are, “What sales district do you want to report on?” and “What is the minimum sales amount you want to see?” Questions such as these let the user take a report that was designed to be used by multiple people and only view the data that he or she is interested in. The biggest benefit is that you don’t need to save a separate copy of the report for each user. New parameter values can be entered each time the report is viewed. Figure 4-aa shows a parameter prompting the user for a report date and the print range.
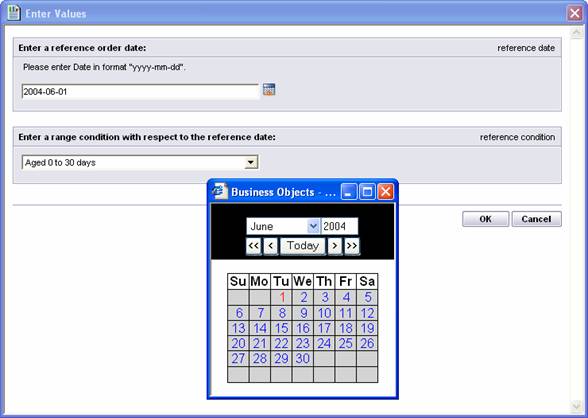
Figure 4-aa. Parameter prompt dialog box.
In this example the user is being prompted to enter two parameters. The first being an Order Date and the second is a date range. You can see a calendar displayed on the screen as well. Crystal Reports lets the user enter dates by typing them in directly or picking the date from this calendar control.
Tip
This dialog box is fully customizable. You can change the fonts and colors by modifying a single file. This is discussed at the end of the chapter in the Advanced Tutorials section.
Parameters are used for many purposes. As I mentioned already, the single biggest purpose is filtering data based upon a user’s needs. But there are many other uses for parameters. They are also used to customize the report format. A sales report can highlight in red all sales persons whose quarterly sales fall below a certain level. A standard report can be customized to hide report objects that aren’t relevant to the user. Requiring a user to enter their User Id lets you hide or show sensitive information. And in the Chapter 3 Advanced Tutorials you saw how to use parameters to perform dynamic grouping and sorting. Creative use of parameters gives you a multitude of ways to make a report respond to a user’s needs.
Creating Parameters
In their simplest form, parameters are used as an easy way to let the user enter a value. At another level, they can be thought of as a way of creating advanced input boxes. When creating a report that uses parameters, you have many jobs to do. It’s your job to determine how the parameter prompts the user to enter a value, determining the types of values that can be entered, deciding if there will be default values, and using the parameter within the report. The remaining portion of this chapter walks you through all the steps of creating parameters and using them in your reports.
Note
New to Crystal Reports XI is the ability for parameters to present the user a list of live data values to choose from. In previous version of Crystal Reports the user could only choose from a static list of values that you created in advance. The values weren’t able to reflect recent changes to the database. Crystal Reports XI now gives this powerful new feature. This is discussed in more detail later in the chapter.
Creating a new parameter is controlled via the Create New Parameter dialog box. This is accessible via the Field Explorer window. Right-click on the Parameter Fields node in the Field Explorer window and select New.
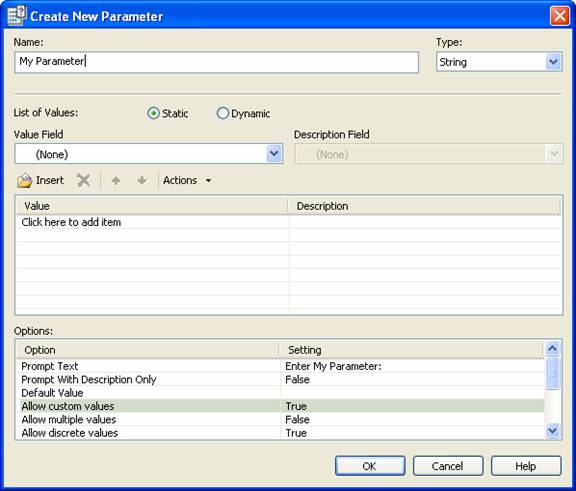
Figure 4-cc. Create New Parameters dialog box.
This dialog box has a multitude of properties that can be set and its going to take some time to discuss them all. So lets start at the top and work our way down.
The top of the dialog box lets you enter the parameter’s name and data type. The parameter name is how you identify the parameter within the report (e.g. how you would reference it in a formula). It should be something that makes sense to you as the report designer. Although it will be shown to the user, it won’t be in a prominent position and you shouldn’t worry about how it looks to the user. Look at Figure 4-aa and you’ll see that the name is shown in the top right corner of each parameter prompt. It isn’t very obvious and most uses might not even notice it.
The problem a lot of people have when they first start creating reports is that they give parameters generic names that don’t specifically state their purpose. For example, if a parameter is used to filter purchases by date range, then you might give it the name PrintDates. This seems like a good idea at first, but when you come back to make changes to the report in six months you won’t have any recollection about which dates this parameter is referring to. Is it the date the product was ordered or the date it was sold or the date it was shipped? You can’t tell by looking at the parameter name. You have to edit the record selection to find out which field it is being compared to. A much better idea would be to call it something like PurchaseDateRange. If you have to edit the report at a later date you’ll immediately know what the parameter refers to. You want to keep the parameter names short, but also meaningful.
Choosing the Data Type
After entering the parameter’s name, you have to select its data type from the dropdown list in the top right corner of the dialog box. A parameter stores information inside the computer’s memory as one of five possible data types: Boolean (True/False), String (text entries), Number, Currency (monetary values) and Date/Time. Selecting the right data type is critical because each data type has benefits and limitations.[2]
Determining the proper data type is usually not very difficult because the data type is defined by how the parameter is going to be used in the report. For example, if you are asking the user a Yes/No question then the data type is Boolean. If you are asking the user to enter their User Id for security purposes, then the parameter is a String data type. Another example is a parameter used in the calculation of a sales commission. It must be a Number data type. Although the user could type in the same numbers using a String data type, you wouldn’t be able to use it in any calculations.
Most reports use parameters to compare them to a database field. This is commonly done for the purpose of filtering data. The rule of thumb to follow is that the parameter’s data type must be the same as the field it is being compared to. If you are using a parameter to filter on the Country field, then the parameter is a String. If you are filtering on a salesperson’s quarterly sales then the data type is Number.
Creating a List of Values
When the user is presented with a parameter prompt, rather than make them type in a value for the parameter, you can give them a list of possible values to choose from. This is called a List of Values. It is a predefined list of default values that the user can choose from. For example, rather than having them type in the State, you can show them a list of all possible states and pick the one they want.
A list of values is helpful for two reasons. The first benefit is that the user doesn’t have to know the options ahead of time. It’s not hard to remember the name of a state, but it might be harder to remember the product names of every product your company sells. The second benefit of using a list of values is that it prevents data entry errors. For example, someone might not remember the exact abbreviation for each state and they could type in the wrong value. Choosing from a list of values ensures that value is entered exactly as expected. Figure 4-cc shows a parameter prompting the user to select the Country to print and letting them choose from a list of all available countries on the report.
The middle section of the Create New Parameter dialog box is where you define the list of values. The first option to choose from is whether the list is static or dynamic. A static list is a predefined list of values that are the same every time the report is run. For example, if you create a report that lists employees by department, you would type in the name of every department into the static list and this is what the user can choose from. The problem with using a static list is that the only way to update the list is to modify the report definition to add or delete department names. The list can easily become out of date if you are too busy to maintain it or if copies of the report were distributed throughout the organization and you may not even know who actively uses it anymore.
New to Crystal Reports XI is the option to make a list dynamic. This is called Dynamic Cascading Prompts (DCPs). The prompts are directly linked to the database and the list never goes out of date. As soon as the data in the database changes, the report will recognize this and present the user with a list of values that reflects any changes. One problem with DCPs is that they incur more overhead because every time the report is run it has to query the database to get the latest list of values. Thus, although DCPs insure that the data is always up to date, there are times it isn’t the most efficient solution.
Learning how to create DCPs is a much more advanced topic than building a static list of values. In fact, it builds upon the learning concepts for creating a static list. Consequently, this chapter firsts cover the steps of creating parameters based upon a static list of values. The end of the chapter will build upon this knowledge and show how to create take the same concepts and use them to create DCPs that pull directly from the database server.
There are three ways to create a static list of values: type in each entry manually, pick values from the database, and import values from a text file. The next three sections show you the details of doing each method.
Manually Entering a List of Values
The easiest method of populating the List of Values is to manually type each entry. By clicking the Insert button the cursor is moved to the first available line in the list and you can type in the value. Alternatively, you can also just click directly on the line without using the Insert button. Hit the Enter key to save the value in the list. Repeat the steps to enter as many items as necessary. Every item listed in the Value column appears to the user as one of the default values they can choose from for that parameter.
Sometimes the items in the Value column are codes or abbreviations for data and the user may not understand what these codes mean. For example, a parameter that specifies a range of account codes might need the value to be formatted as 50xxx for Revenue accounts. But the user has no idea what “50xxx” means. It would be better if they could choose the word “Revenues” from the list and behind the scenes let the computer take care of the fact that it is really 50xxx. You can do this by using the Description column. The Description column, located next to the Values column, gives you the option of showing descriptions of the values to the user. For values that are somewhat cryptic (e.g. inventory codes), this makes it easy for the user to understand what they are selecting.
To have a description appear in the list of values, type
in each value’s description in the second column and it is shown to the user.
Note that it’s not required that every value have a description. Just do it for
the values that you think the user might not understand. It’s also optional
whether the description is shown next to the value or if the user only sees the
description. For example, look at the next two figures and compare how the
value
The first figure shows the value, “
If you want to sort the list of values, simply click on the column header. It will reorder the list so that all the items are sorted in ascending order. To sort in descending order click on the header again to toggle the sort direction. If you want to sort by description instead of the actual values, click on the description column header.
Using a Table to Populate the List of Values
The drawback to populating tables manually is that you have to type in each entry yourself. If the list of values is going to be large then this could take a lot of effort. In addition, you have to be careful that you spell everything exactly and that there are no typographical errors. An easier way to enter values is to import the values from a database table. This saves you time by not having to type everything and you don’t have to worry about making errors.
Populating a list of values from a database is done by selecting the table and field that has the data you need and then selecting the entries to use. On the dialog box look below the option where you select either Static or Dynamic and you’ll see two dropdown boxes labeled Value Field. Click on the dropdown box to see a list of all the tables and fields in the report’s data source. Find the table which has the data you need and select the field to pull that data from.
The Description column can also be populated with a database field by clicking on the Description Field dropdown box. By default this dropdown box is disabled until you select a field for populating the Values column. Then the Description Field dropdown box automatically becomes enabled. The reason for this is that if you aren’t going to use a database field for populating the Values column then you can’t do it for the Description column either.
Note
When selecting the field for the Description column, make sure
that it is a field that is in the same table as the field selected for the
Values column. For example, if the Values column uses ProductId
field from the Product table, then the Description column should come from the
Product table as well and would probably be ProductName. If you
select a field for the Description that is in a different table,
You should be careful when selecting the table and field to use for importing data into the list of values. For the purpose of importing values, you need to figure out which table is the primary table (if it even exists). The primary table lists every possible value for a field and has a single field that is a unique identifier for each row (called the Primary Key).
If you aren’t familiar with the database then you should consult the database administrator for help. If you have a basic familiarity with databases then you can probably identity the primary table yourself. Some ways to identify which table is the primary table is that there is exactly one record for each item (there are no duplicate records), and there are usually fields that store its name, description, etc. For example, a Product table would list each Product Id (the primary key) as well as listing its name, price, and possibly size or weight.
A table that isn’t the primary table usually lists a field
as a secondary field within another primary table and the data is repeated
multiple times. For example, a Customer table is the primary table for
customers. It only lists exactly one record per customer. Within the Customer table
are going to be fields such as the Address and Country. Both the Address and
Country fields are secondary fields within the table. They give additional
information about the Customer record, but aren’t the primary fields.
Consequently, the values in the secondary fields can be repeated multiple times
within the table. For example, many customers are going to have a Country field
with values such as
Depending upon the data that you are displaying, there isn’t always a primary table in the database. For example, a sales report that lets a user filter by Country probably doesn’t have a Country table in the database. Instead, it just lets the user type in a country’s name and it filters all records that have the same country name. If you aren’t working with the primary table then there can be a problem for you when you import the data. The table might not have a complete list of values. If the table doesn’t have much data in it yet then it is very likely that it won’t have an exhaustive list. If this is the case, after you import the data from the table you will have to add the missing values manually. That is why it is best to first determine if the database has a primary table for your data because this will make sure that you load every possible value at one time.
Note
Don’t worry if the database doesn’t have a primary table for your data and instead you have to select a table that repeats a value multiple times. Before importing data from the table, Crystal Reports examines the table and generates a unique list of values. This ensures that each value is only imported once.
Just telling Crystal Reports which field will populate the list of values isn’t enough to get the values there. You have to tell it how to do that as well. This is because you have two choices for importing values. You can either add them one at a time or add the entire list at once. Of course, adding the entire list is most efficient way if there are lots of values. But if you only need a subset of all the possible values then you can pick and choose which ones to import on an individual basis.
To import every value into the list, click on the Actions button and select Append All Database Values. This scans through the entire table and adds each value to the list. If you selected a field for the Description column, then the descriptions get imported as well.
If you don’t need to import every single value, you can import them individually. This is more work, but it’s a practical solution if you only need a few of the values. To select values individually, Click on the row that says Click Here to Add Item. This displays a dropdown arrow on the right side of the column. Click on the arrow to see a list of all the values in the table. Select the one you want and it gets added to the list. Repeat this procedure for every item to be added to the list.
Tip
If you need to import a lot of the values from the table, but not every one, then you might be tempted to add them individually. But a better idea is to import the entire list and then delete the ones you don’t need. Depending upon how big the list is, this can be much faster than selecting the values on an individual basis.
A word of caution when using a database to add individual items to the list of values: when adding individual items the Description column doesn’t get filled in for you. Even if you have a field specified for the Description column, nothing gets inserted. Only the Values column gets populated. You have to type entries in the Description column manually. Hopefully, this problem will be corrected in a future maintenance release.
Note
Building a static list using a database field doesn’t create a live connection to the database. If the values in the database field change then this will not be reflected in the list of values. You will have to go back and add the entries yourself. This is where using dynamic prompts are beneficial and this is covered later in the chapter.
The final method of populating the list of values is by importing them from a text file. If you have a text file that lists each value and its description, you can import these values without doing any typing. This can be useful if you are importing values from a third-party application and it has the option to export data. It can also be useful to manually create a list of values in a report and export that list to a text file. Then you can reuse it in other reports by importing it. The format of the text file is that the Value is listed first and the Description should be separated with the TAB key. Each Value/Description combination should be on its own line.
Editing the List of Values
After you populate the values and descriptions for the user to choose from, you need to know how to revise the list and keep it updated. After importing or entering the values you might notice that they are listed in no particular order. The first thing you might want to do is sort the list in either ascending or descending order. There are two arrow buttons shown directly to the left of the Actions button. Clicking on the first arrow sorts the values in descending order and clicking on the second arrow sorts in ascending order. If you need to delete one of the items from the, click the delete button (it looks like an X) located directly to the right of the Insert button. If you make a mistake during the process of adding values, you can reset the entire list by clicking on the Actions button and selecting Clear.
Tutorial 4-3. Creating Parameters
Let’s do an example illustrating what we’ve learned so far about creating parameters. We’ll create two parameters and create the list of values for each one differently. The two most popular ways of entering data are to do it manually (when the number of items is small) and to import from a database (when the number of items is large). We’ll create a parameter using each of these methods. Secondly, we want to practice creating a record selection formula that is more complicated than what can be created using the Select Expert. This was discussed earlier in the chapter and now we’ll get a chance to do it.
The sample report we are going to start with is the
Group.rpt that was used in the earlier tutorials. It shows last year’s sales by
country and customer name. We are going to modify the report so that it can be
used by managers that are based in
Lastly, we are going to use the Select Expert to create a record selection formula that uses these two parameters to perform the filtering of the data. But rather than use the default formula that gets created, we are going to modify it so that the user can enter only one of the two parameters and the report will filter on just the field they want.
1. Open the Crystal Reports sample report Group.rpt. This report shows the last year’s sales for each customer and it is grouped by the Country field.
2. Save it as “Basic Parameter Tutorial.rpt”.
3. Right-click on the Parameter Fields list in the Field Explorer and select New. This opens the Create New Parameter dialog box.
4. Enter the parameter name “Selected Country” and leave it as a String data type.
5.
Since the report is only for managers in
6. In the Options section below, enter the prompt, “Which Country to print? Enter blank for All.”
7. Click the OK button to save the parameter and close the form.
8. Create the next parameter by right-clicking on the Parameter Fields list and again selecting New.
9. Enter the parameter name “Selected Customer” and change it to a Number data type.
10. The database has a huge number of customers to choose from and we aren’t about to type them all in manually. It’s much better to import them directly from the database. Click on the Value Field dropdown box and select the Customer Id field. In the Description column select the field Customer Name. This lets the user view the Customer Name when they are selecting the customer, but behind the scenes the parameter is storing the Customer Id field. This is important because although it is unlikely that there would be a duplicate customer name in the database, if it did happen then you will get the data from two customers mixed together. Using the Customer Id field insures that you only filter on a single customer.
11. Click on the Actions button and select Append All Database Values. This imports every value from the database and automatically populates the list of values.
12. In the Options section below, enter the prompt, “Which Customer to print? Enter 0 for All.”
13. Click the OK button to save the parameter.
14. Now that the two parameters have been created, it’s time to build the selection formula.
15. Click on the menu items Report | Select Expert.
16. Select the field Customer.Country and click OK.
17. Select the comparison Is Equal To and select the parameter {?Selected Country}.
18.
Click the New button and select the field
19. Select the comparison Is Equal To and select the parameter {?Selected Customer}. At this point, the Select Expert has created a formula where both the Country and Customer Id must match what the user selected for a record to print. But this isn’t what we want. We want to let the user print the report based on either the Country or the Customer, but not both. We need to modify the formula so that it uses this logic.
20.
Click on the Formula Editor button and
look at the current selection formula.
{Customer.Country} =
{?Selected Country} and
{Customer.Customer
Id} = {?Selected Customer}
21.
The basic logic is already there, we just need
to modify it so that it only tests one field at a time rather than both fields.
if {?Selected
Country}<>"" Then
{Customer.Country} = {?Selected Country}
else
{Customer.Customer Id} =
{?Selected Customer}
22. Click the OK button to save the selection formula.
23. Preview the report and play around with it for a minute. You’ll see that you can filter just by Country or you can just print an individual Customer’s data.
Setting Parameter Options
You can do more with parameters than just display a list of default values for the user to pick from. Some of the advanced features are the ability to enter single or multiple values, set a range of valid entries, and control data entry using an edit mask. At the bottom of the Edit Parameters dialog box is an Options area that lists the available options that can be set for a parameter. Each of these options is listed below with a description of how to use it.
Prompt Text
The prompt text is the question that prompts the user to enter a value. You can type in any text that would describe to the user what type of information they are being asked to enter. It can also be helpful if you tell the user how the parameter is used. For example, rather than just saying, “Enter the country”, the prompt could say, “Enter which country you want to print the sales for”. This tell the user what data is needed and why.
Prompt with Description Only
We already talked about this option in an earlier section. It gives you the option of showing the value and its description or of only showing the description. Just showing the description is useful when the value is a field that wouldn’t make sense to the user (such as a cryptic Inventory Id).
Note
Even though you have the option of showing only the description to the user instead of the actual value, behind the scenes Crystal Reports is storing the value field in the parameter. The user will never see this, but you need to make sure that any formulas you write with that parameter are done so with the expectation of using the value field. The description is strictly used for display purposes and nothing else.
Default Value
Even though some parameters have a large list of values to choose from, there can still be one value that is used the majority of the time. When this is the case you can have Crystal Reports display a default value. The user can just click the OK button rather than typing in the value themselves. Of course, if the user doesn’t want to use the default value, he can override it with a new value.
Allow Custom Values
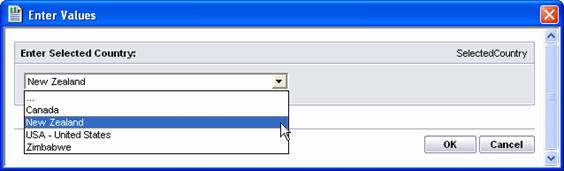
So far, everything we discussed in reference to the list of values assumes that the user always wants to pick a value from the list that you created. However, this isn’t always the case. For example, the list of values might be out of date and you haven’t had time to add the new entries. Thus, the user needs the ability to enter a value not in the list. You could also have a list of values that just show the user the most used values, but it doesn’t show every single value because there are too many to view. In this case the user can enter a new value if the value he needs isn’t in the list.
When the Allow Custom Values option is set to True, the user is presented with a second text area that is shown directly below the list of values dropdown box. The text area allows you to enter any value for the parameter.
The following figure shows a parameter that has a list of values and it lets the user enter a custom value. The list of values dropdown box is shown at the top and the text area to enter a custom value us shown directly below.

Min/Max Length
If the parameter’s data type is String, you can set the minimum and maximum number of characters that the user can enter. Crystal Reports will only accept a parameter that meets the two criteria. This helps enforce data rules related to string length. For example, if a parameter filters on the state’s abbreviation (KY, CA, etc.), then the Min Length would be 2 and the Max Length would also be 2.
You don’t have to enter both a Min Length and Max Length property for each parameter. You can set just one of the properties or neither. For example, most passwords have a minimum length requirement but no limit on the maximum number of characters you can enter.
The Min and Max Length properties are only available for String data types. They do not apply for Numbers, Dates or Boolean data types. However, both Numbers and Dates do let you specify the minimum and maximum values.
Min/Max Value
Parameters of the data types Number and Date can have valid ranges assigned to them. This prevents the user from entering a parameter value that is outside the acceptable range.
For the Date data type, the range properties are called Start and End. Although they are named differently than the Number properties, they mean the same thing.
Edit Mask
Some string parameters have a format where special characters appear within the string at particular locations. For example, a phone number has the format of (999) 999-9999. No matter what the phone number is, it has to be formatted the same every time. Crystal Reports gives you the ability to specify an edit mask for string parameters. The edit mask forces the user to enter a string in a very precise way. If there are special characters such as a dash or colon, it forces the user to type in the field exactly and it guarantees that the data they entered is formatted properly.
Edit masks can be a little confusing if this is the first time you’ve ever used them. Each edit mask consists of a bunch of characters and each character has a rule that specifies what the user can and can’t type in the position. But edit masks aren’t hard to use once you understand the rules. You just have to practice a few times to get the hang of it. Let’s start by looking at a few simple examples and then we’ll look at what the rules are.
Social Security Number: 000-00-0000
The “0” in the edit masks says that the user must enter a digit from 0-9. The first three characters will be numbers. The dash is a special character that is must always stay the same. The user can’t replace it with another character. Thus, this edit mask requires the user to enter a certain quantity of numbers with dashes in between.
Phone Number: (000)000-0000
This edit mask is similar to the social security edit mask. The only difference being that the parentheses are also treated as special characters.
State Abbreviation: >AA
A state abbreviation is always two characters long. This edit mask uses the A character to force the user to enter a letter. What makes this edit mask interesting is that is also uses the greater-than sign at the beginning. This requires all letters to be entered as upper-case. This is useful when doing text searches that are case-sensitive.
Note
One thing to be aware of is that by using an edit mask you are indirectly specifying what the Min Length and Max Length properties are. Since the edit mask specifies how many characters must be typed in, the user can enter no more and no less. Thus, when using an edit mask it isn’t necessary to also specify the Min Length and Max Length properties.
Table 4-cc shows the rules for creating edit masks.
|
Character |
Edit
Mask Rule |
|
A |
Must enter an alphanumeric character. |
|
a |
Allows entering an alphanumeric character, but its optional. |
|
0 |
Must enter a number from 0-9. |
|
9 |
Must enter a number from 0-9 or a space. |
|
# |
Must enter a number from 0-9 or a space or the plus or minus sign. |
|
L |
Must enter a letter from A-Z. |
|
? |
Allows entering a letter from A-Z, but its optional |
|
& |
Must enter a letter from A-Z or a space. |
|
C |
Allows entering a letter from A-Z or a space, but its optional. |
|
,.:;-/ |
Special characters that must be entered by the user. |
|
< |
Any characters following the less-than sign must be lowercase. |
|
> |
Any characters following the less-than sign must be uppercase. |
|
\ |
This makes any character a special character that must be entered exactly. For example, and inventory part number might always have the letters PN at the very beginning of it. |
|
Password |
All characters are shown as an asterisk so that the data can be kept secret. |
Table 4-cc. The rules associated with each character in an edit mask.
NOTE
When the user enters a parameter value that doesn’t match the edit mask, the error messages aren’t always very helpful. First of all, if there are multiple errors in the value, the user is only told about them one at a time. After she corrects one error and clicks the OK button, she is then presented with the next error message. It would be helpful if a bullet-point list of all the errors were shown at once. Secondly, the dialog box always displays the edit mask to the user so that they know what type of data entry is expected. This is certainly helpful for the person who designed the report, but most users are not going to have any idea what all these funny characters mean. For some users, seeing the edit mask can do more harm than good. The best way to keep this from hindering your reports is by using preventive medicine. Within the prompt text you should indicate to the user what the edit mask rules are so that the user knows in advance the proper way to enter the data. For example, if you want them to enter a two digit state abbreviation and have each letter upper case, then just say so. Make the prompt text say something like, “What state do you want to filter on? Please enter the two letter abbreviation using uppercase letters (e.g. KY).”
Multiple, Discrete and Range Values
The last three options we haven’t discussed yet are in regards to parameters that have more than one value associated with them. These three options can be used in conjunction with each other and it helps to get an understanding of them at the same time.
A parameter has the flexibility to store a single value, a range of values, or a combination of the two. This gives you a lot to think about when deciding which is appropriate for each parameter. Discrete parameters are good when you need to store a single value. An example is when you want to print a report based on a Company Id. Another example is storing a Boolean value that enables a report feature to be displayed.
Range values give you more flexibility by allowing you to set a start and end point of acceptable values. Any value that falls within this range is included. This is useful anytime you want to print multiple values and these values have a definite starting point and ending point. Range values are frequently used when filtering dates because you can set the beginning and ending dates and all dates in between get included.
Parameters let you go one step further by combining both discrete values and range values into the same parameter. These are called multi-value parameters. A multi-value parameter is a list of different values (i.e. an array of values[3]). This gives the user the ability to create a list of acceptable values that can be discrete values, range values, or a combination of the two. This can result in a complex list of acceptable values. For example, consider financial reports which are often based on account codes. Each type of account category (assets, liabilities, etc.) is represented by a starting and ending range. An auditor that is investigating fraudulent information could print out certain related accounts by entering multiple account codes such as 10000-11000, 50000-51000, and the individual accounts 05928 and 05970. The multi-value parameter lets all the accounts be printed on the same report for easier analysis. If the report didn’t use a multi-value parameter then each of these accounts and account ranges would have to be printed on a separate report and pieced together. Table 4-bb shows a summary of the different type parameter options.
Table 4-bb. Options for parameter fields
|
Option |
Description |
|
Discrete value(s) |
The user must enter must a single value. |
|
Range value(s) |
The user enters two values that are the beginning and ending points of a range. The range includes the values entered. For example, if you entered a range of 1,000 and 1,999 then it would include all numbers from 1,000 up to and including 1,999. |
|
Allow multiple values |
Allow a parameter to accept more than one value and store them as a series. |
Now that you understand the different data types and options available for parameters, let’s look at how to create parameters in a report.
Using Boolean Parameters
Boolean parameters are unique from the other parameter types because they can only hold one of two values and they can be grouped together. With other types of parameters you can list many possible choices in its list of values. But Boolean parameters don’t let you decide the list of values.
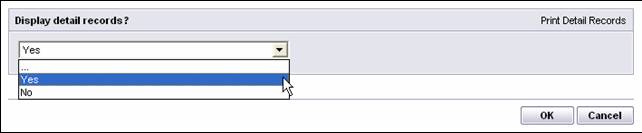
Although the possible values are always True and False, you aren’t required to display True and False to the user. You can present the user with a better prompt by changing the Description of each parameter. For example, a report that optionally formats low inventory items in red could have two prompts which say, “Highlight low inventory items” for True and, “Don’t show inventory alerts” for False. Changing the description makes it easier for the user to understand what the report is asking for. The following figure shows a parameter that displays Yes and No rather than True and False.
Boolean parameters can also be group together. Grouping Boolean parameters is beneficial for organizing the values together. You often see this type of group selection on websites when you are filling out forms. It’s represented by a radio button where you are only allowed to have one option selected at a time. If you try to click on a second option then the previous selection automatically gets unselected. Then this is the same as grouping parameters in Crystal Reports.
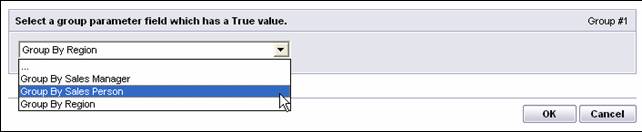
There are two ways to specify a Boolean group: Non-Exclusive or Exclusive. An Exclusive group only allows one parameter within the group to be set to True. The parameters are displayed in a dropdown box and only one item can be chosen within the dropdown box. For example, a sales report could group the data based on a single field and the user gets to choose which field that is. You could prompt the user to specify whether the report should be grouped by Sales Manager, Sales Person, or Region. Since the report only has one group defined, the user can only select one field out of the whole list. Thus, this is an exclusive group. The next figure shows an Exclusive group that prompts the user for which field to group by. The dropdown box shows all three parameters and the user can only select one of them.
Caution
Looking at the above figure you should notice a few unusual aspects of it that differ from the typical parameter prompts we’ve seen so far. First off, notice that in the top right corner it shows the group number. This is normally where the parameter name is displayed. Personally, I don’t think many users care about which group number this parameter belongs to and this could probably be hidden with no ill effects. Secondly, notice that the prompt text is very generic. This is because every parameter group always shows the same prompt text. Even if you specify the prompt text in the Options area, this is ignored by Crystal Reports and it never gets displayed. Last, but not least, notice that the values that appear in the dropdown box are actually the parameter’s names. It doesn’t say True or False. And if you enter a description in the list of values, this gets ignored as well. Since both the prompt text and the description properties are ignored for Boolean groups, you have to make sure you name the Boolean parameter in such a way that it will make sense to the user when the see it listed in the dropdown box.
The Non-Exclusive group says that all or none of the parameters can be set to True. By definition, since this is a non-exclusive grouping then there are no limits to how many parameters can be set to True. For example, a report can have certain features enabled or disabled and the user selects which options she wants to see. The user can select no options, one option, or multiple options. No parameter excludes the other parameters from being selected.
Since the user can specify one or all of the parameters within the group to be True, this really isn’t any different than just using individual Boolean parameters. But there are a couple benefits to using Non-Exclusive Boolean groups. The first is that by grouping the parameters into a single area, it makes it clear to the user that all the parameters are logically related to each. The second benefit is that there is only one prompt for all the parameters. If they weren’t included in the same group, then you would have to create prompts for each parameter and since they all relate to each other, the prompts are going to be very redundant and not convey any additional information that would help the user. Thus, putting related Boolean parameters into the same group makes it easier for the user to understand what she is selecting. The next figure shows an example of a parameter that lets the user choose which sensitive fields should be hidden so that people reading the printed report don’t see this information.

Setting the grouping properties of a Boolean parameter is done in the Options dialog box. When a parameter’s data type is set to Boolean, two new properties appear the end of the Options list: Boolean Group # and Exclusive Group. If you want the parameter to be in a group, then enter a group number in the option Boolean Group #. The group number is an arbitrary number that you make up and you have to make sure you keep it consistent so that the proper parameters are put into the right group. If you want the group to be an Exclusive group, then enter the value True in the Exclusive Group option. If you want the Boolean parameter to just be treated like any other parameter (i.e. as a standalone parameter), then leave both of these options alone.
Managing the Parameter List
Sometimes after adding a parameter to the report you need to modify it. This could be renaming it or changing its options. As you might expect, Crystal Reports lets you perform the typical maintenance tasks with parameters. You can modify them, delete them, rename them and reorder them.
All the tasks for working with parameters are in the pop-up menu that appears when you right-click on a parameter in the Field Explorer window. To Edit a parameter, select the Edit option from the pop-up menu and it opens the Edit Parameter dialog box that you’ve been working with in this chapter. Make the necessary changes and click the OK button to save it. To delete a parameter select the Delete option from the pop-up menu.
If you wish to rename the parameter you have to select the Rename option. Interestingly enough, if you try to rename the parameter within the Edit Parameter dialog box it won’t let you do it. The dialog box has the parameter name as a read-only property that you can’t change. You are only allowed to rename the parameter using the pop-up menu.
Note
If you rename a parameter field, Crystal Reports automatically finds all references to the parameter and updates them. You don’t have to worry about your formulas breaking because they parameter name was changed.
When a user opens a report with parameters, the parameters are listed within the same dialog box. You may not have given much thought to the order that the parameters are listed in, but they are listed in the order that you created them. In fact, if you look at the Parameter Fields list in the Field Explorer window, you’ll see that their order in the Parameters Fields list is how they appear to the user. You can reorder the parameters so that the more important parameters are listed first. Right-click anywhere on the Parameter Fields list and select the option Set Parameter Order. The Parameter Order dialog box appears and shows you a list of every parameter in the report.

Figure 4-hh. Reordering parameters with the Parameter Order dialog box.
To change the parameter order, click on the parameter you wish to move and then click on the up and down arrows located in the top right corner. Click Ok to save your changes and you’ll see that the Parameter Fields list is updated to reflect the new order. That is how they will appear when you refresh the report data.
Tutorial 4-4. Creating Multi-Value Parameters
The benefit to setting parameter options is that they give the user a more robust user interface for selecting parameter values. Let’s modify the report we created in the previous tutorial so that rather than just selecting a single Customer to print, the user can select multiple customers.
1. Open the report “Basic Parameter Tutorial.rpt” from Tutorial 4-3. Save it as “Multi-Value Parameter Tutorial.rpt”.
2. Look in the Parameter Fields list and find the Selected Customer parameter. Right-click on it and select Edit.
3. For the optional properties, set the Allow Multiple Values option to True. This lets the user select the customers they want to print by either adding creating a list of valid customers.
4. Click the OK button to save your changes. This immediately opens the Enter Values dialog box so that you can enter a new value for the parameter.
5. Refresh the report multiple times and select a different number of customers each time. They will all appear on the report.
6. Notice that even though we changed the parameter to be multi-value, the selection formula stayed the same. When Crystal Reports compares a single field to an array of values, you can still use the = operator to do the comparison. Crystal Reports automatically scans through the array looking for a value that matches. This is discussed more in the next section.
Using Parameters
After you’ve created the necessary parameters, you need to know how to use them within your report. After doing all this work, you don’t want it to go to waste!
There are three primary ways of using parameters: filtering records, displaying on the report, and using in conditional formatting. We’ll discuss the first two methods here, but put off the discussion of conditional formatting till Chapter X where it is covered in more detail.
At the beginning of the chapter we learned how to filter records by setting the criteria that a database field has to meet in order for a record to be displayed. The discussion was confined to the examples where you hardcode within the selection formula the text/number/date that the field is compared to. The problem with this approach is that the report uses the same filter every time it is run. There isn’t any room for flexibility based on the user’s needs. This is where parameters come in. By using parameters within a record selection formula, the filter changes each time a user runs the report because the user can enter a new value for each parameter and this is immediately reflected in the selection formula.
Selecting Records with Parameters
Using a parameter within a record selection formula involves the same process that was discussed in the first half of the chapter. You follow the steps to set which field to filter on and set the filtering condition (equal to a value, within a range, etc.). The difference is when you set the value to filter with, you now choose a parameter field. The parameter is listed with a ? in front of it. The next figure shows using a parameter to filter the Country field.

Filtering on range and multi-value parameters has a few idiosyncrasies that you need to be aware of. As you know, these types of parameters are more complex due to the fact that they store more than just a simple value.
Range parameters consist of a start value and end value. The only conditions you can use with range parameters is the Is Equal To and Is Not Equal To. This is the equivalent of testing whether a value falls within the range (Is Equal To) or if it falls outside the range (Is Not Equal To).[4] Multi-value parameters consist of multiple discrete values or multiple range values. Just like range parameters, the only conditions you can use are the Is Equal To and Is Not Equal To conditions. Using the Is Equal To comparison looks at each of the individual values within the parameter and determines if it is equal to any one of those values. It only needs to match one value for the record to match the condition. Consequently, the Is Not Equal To condition is a match if the value isn’t any of the parameter values.
Printing Parameters
The second method of using parameters is displaying their value on a report. There are various reasons for displaying parameters on a report. A very common reporting requirement is that when filtering data it is helpful to print the filter criteria so that anyone reading the report knows that only subset of all the available data was printed. For example, if a report prints records within a certain date then you could show the date range within the report header. You can also use a parameter strictly for the purpose of displaying the data on the report. For example, printing an invoice could use a parameter to let the user enter a note at the bottom of the invoice to alert the reader of new shipping requirements or tell them about an upcoming price increase.
The way you print the parameter on the report is dependent on the type of parameter it is. Printing a discrete parameter on a report is simple because a parameter is treated the same as any other field. Simply drag and drop it from the Field Explorer onto the report and it will be printed. Printing range and multi-value parameters is more complex because they are represented internally by more than one value. You have to use formulas to tell the report how to display the data.
Each parameter type requires a different formula for displaying its information.[5] Range parameters have a start value and end value. Crystal Reports has two functions for working with range parameters: Minimum() and Maximum(). When you pass a range parameter to these two functions they return the beginning and ending values respectively. Here is an example of using these functions in a formula:
“This report covers the dates from “ & Minimum({?DateRange}) & “ to “ & Maximum({?DateRange})
The functions Minimum() and Maximum() are concatenated within a string telling the user the selected date range.
Printing multi-value parameters requires a function that involves more complex programming logic. This is because a multi-value parameter is an array of other values. These values can be either discrete or range parameters. The formula for printing a multi-value parameter is to loop through each item in the array and print it out. I built a sample formula for displaying all the multi-value parameter values and separate each one with a comma.
NumberVar Index;
StringVar Output;
StringVar LowerValue; StringVar UpperValue;
for Index := 1 to UBound({?
(
//Add a comma to separate values
If Output <> "" Then
Output := Output & ", ";
LowerValue := "";
UpperValue := "";
//Get the upper and lower values
If HasLowerBound
({?
LowerValue :=
Minimum({?
If HasUpperBound
({?
UpperValue :=
Maximum({?
//Discrete values have the same upper and lower bound
If LowerValue = UpperValue Then
Output := Output & LowerValue
Else
//Print the range values
(If LowerValue <> "" Then
Output := Output + " From " & LowerValue;
If UpperValue <> "" Then
Output := Output + " To " & UpperValue;)
);
//Clean up the Output string
Output := "The valid values are: " & Output;
The formula starts out by declaring the variables it needs to work with. Then it uses a For Loop to cycle through each item in the array. Within the For Loop it builds the Output string. The first task is to check if the Output string has a value from a previous iteration of the loop and if so append a comma to the end.
Then the LowerValue and UpperValue variables are populated based upon whether the parameter value has an upper and lower bound. It uses the HasLowerBound() and HasUpperBound() functions to determine this.
Lastly, it concatenates the values to the Output string. If the lower and upper bound values are the same then this is a discrete parameter value. If they are different then it is a range parameter value and we want to display the minimum and maximum values.
The For Loop performs this logic for all values in the parameter. An example of the final output is:
The valid values are: Argentenia To Australia,
Creating Formulas with Parameters
The third method of using parameters is within formulas. You’ve already seen examples of this throughout the chapter by modifying the records selection formulas. This can also be used with formulas for conditional formatting or for performing calculations. This is discussed in more detail in Chapter X.
Entering Parameters
Creating parameters and using them within a report’s selection filter and its formulas is just one aspect of parameters. The second part is when the user runs the report and enters the data into the parameter fields. Although this is a pretty simple process, it helps to review it to make sure you are familiar each aspect of it.
When a report opens the first time it presents you with the Enter Values dialog box. This dialog box lists all the parameters used in the report.[6] Each parameter is listed in the order that they appear in the Field Explorer window and each parameter is enclosed within its own grey box. Within each box is the prompt text that tells the user what to enter and an input area for entering the values. At the bottom of the dialog box are the OK and Cancel buttons for accepting or canceling the input. An example is shown in Figure 4-dd.

Figure 4-dd. The Enter Values dialog box for entering parameters.
If you don’t see the OK and Cancel buttons or you notice that some of the parameters are missing from the dialog box, it is because there are too many parameters to display within the dialog box’s default size. You have to scroll down to the bottom of the dialog box to see the remaining parameters as well as the buttons.
When you refresh the report data by pressing the F5 key or clicking the Refresh Data button on the toolbar, you are asked whether you want to use the existing parameter values or enter new values. If you select the option to enter new values then the Enter Values dialog box is presented again and you can override the existing parameter values.
Crystal Reports presents different prompts for each type of a parameter data type and option available. This creates numerous possible combinations for entering values. Fortunately, they are presented in such a way that it’s pretty obvious how to use each one. We’ll cover the basics here so that you are familiar with them.
The most basic type of parameter prompt is for the single value parameter type. It simply presents you with an edit box for entering the value. If the data type is Boolean, then you are shown a dropdown box that lets you choose True or False.
If the data type is Date, you have to enter the date in the format of “yyyy-mm-dd”. There is a button listed next to the input box that you can click on to display a pop-up calendar (see Figure 4-aa at the beginning of the chapter). The calendar is useful if you need to enter a date at a particular time (the last Friday of the month) and you need to see an overview of the entire month to figure out which date it is. Clicking on a day in the calendar automatically causes the pop-up window to close and it fills in the date for you.
The next parameter type that effects how you are prompted to enter a value is a parameter with default values. This was already discussed this in detail in an earlier section. To summarize, a parameter with default values presents you with a dropdown list showing all the possible default values. Click on the one you wish to use. When using default values, you can set the option that allows the user to enter a custom value. When this is selected, an input box is shown below the dropdown box and the user can enter a value not shown in the default value list. This is shown in Figure 4-dd.
Entering range parameters presents you with more options than the simplistic discrete parameter does. Range parameters let you select a start range and end range. In addition to that, you can specify whether these values should be inclusive or exclusive. You can also specify if there should be no start or end range at all. Figure 4-ee shows an example of entering a range parameter and the options that can be selected.
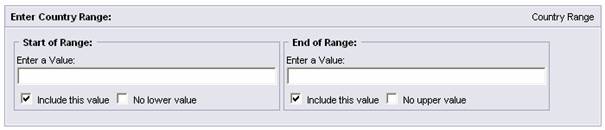
Figure 4-ee. Range parameter dialog box.
Entering the start and end values is done via the two
input boxes located adjacent to each other. Below each input box are the two
options that specify how the value should be used. The first option is Include This Value
and it is checked by default. It specifies that the value you entered should be
included as part of the range. For example, let’s say that you are entering
values for a date range parameter. If you enter the values
This option is useful when the beginning or end of a range
is always changing. For example, let’s say that you want to print the entire
month of February but you can’t remember when there is a leap year. In this
case you would enter an ending range of
The second option is No Lower Value/No Upper Value. This
means that you don’t want to specify a value for the start or end of the range.
By checking the option No
Lower Value, the very first possible value is included in the
range and it goes up to the end range. There is no minimum value in the range. For
example, if you have a date range with No Lower Value checked and an end range
of
Of course, all these range related options can be combined to let you select any possible date range you need. The one thing to be aware of is that when you select one of the options No Lower Value or No Upper Value, then you can’t enter a value for that part of the range. This makes sense because if you specify that there is “No Lower Value” then why would you try to specify a lower value? You wouldn’t and consequently Crystal Reports disables the input box.
The last parameter type to consider is the multi-value parameter. This parameter lets you build a list of acceptable values. It is also the most complex because it lets you combine both discrete and range parameters within this list of acceptable values. Figure 4-ff shows an example of a parameter that lets you specify a list of countries to print. This list can consist of a range of values or the names of individual countries.

Figure 4-ff. Enter multiple values for the Country parameter.
The top of the dialog box is where you enter the range
values. Enter the start and end values and click the
Note
As of this edition of Crystal Reports, all prompts are displayed as simple input boxes or lists. You can’t use prompts such as check boxes or radio buttons. Hopefully, this will be a feature we see in a future edition!
Dynamic Cascading Prompts
Crystal Reports XI gives you a wonderful new feature for working with parameters: Dynamic Cascading Prompts, commonly referred to as DCPs. This gives parameters the ability to be dynamic because they are linked directly to the database. They can also be cascading because the value in one parameter affects the list of values in the next parameter. This collection of related prompts is defined as a “Prompt Group”.
When discussing how to create a list of values for prompts for the user to choose from, this chapter has focused on building a static list of values. This was done by either manually typing in the default values or selecting them from a live database connection. The drawback to both of these methods is that the list of values can potentially be out of date as of the moment you distribute the report. For example, if a list of values lets the user choose from the current customers and your company is always adding new customers, then the list of values will quickly be out of date. You as the report designer will have to continuously update the list of values to reflect the new customers.
DCPs solve this problem by letting you create a list of values that is linked directly the data source. The default values presented to the user are always current and you never have to revise the report to make sure they don’t go out of date.
Static prompts differ from dynamic prompts because static parameters store their list of values internally within the report file. This creates more overhead within the report file. Dynamic prompts only store a link to the database is stored within the report. The data is always derived from the database when populating the list. This insures that the list of values is always current. When using DCPs you have to take into consideration whether everyone has an active link on the network to connect to the database when opening the report.
DCPs give you the ability to link prompts together so that each successive parameter’s list of values is determined by the selection in the previous parameter. The value chosen with one parameter is used to filter the data in the next parameter. Thus, each prompt’s selection “cascades” down to the next prompt.
DCPs are used when the list of values is so large that it would be overwhelming for the user to select from. For example, if the user needs to specify which city to filter on then this list would be enormous if you are selecting from every possible city in the country. However, you can use cascading prompts to ask the user to first select which state they want and then only select the cities within that state. Cascading prompts effectively let you take a large list of values and significantly decrease its size by asking the user preliminary questions to filter out the non-necessary values. Cascading prompts also give your reports a performance boost because there is less load on the database server as the list of values gets filtered down with each parameter.
The benefits of dynamic cascading prompts are as follows:
· Reduce report maintenance because the list of values is always current.
· Simplifies the user interface because the list of values is more manageable.
· Report file size is smaller because the list of values isn’t stored internally.
· Users make better decisions because they get an exact view of their information.
· Improves report performance by querying the database for smaller resultsets.
Caution
There are a few warnings associated with dynamic cascading prompts. The first is that Crystal Reports Standard edition can’t create DCPs. This version can use them to prompt the user properly, but you as a report design can’t use it to create DCPs in a report. The second caution is that cascading prompts must be dynamic. Static prompts can’t be used.[7] The last area of concern is that since dynamic prompts are connected to the database, the database server will be queried every time the parameters are refreshed. If a list of values is small and doesn’t change frequently, you might be better off creating static parameters so that there isn’t unnecessary usage of the database server.
DCPs are backwards compatible with Crystal Reports 10, but only partially. Crystal Reports 10 can open an XI report that has DCPs, but it won’t be able to display the list of values to the user. The user can manually enter parameter values and the report will use them. But the dynamic connection to the database won’t be enabled.
Creating Dynamic and Cascading Prompts
Creating a parameter that uses DCPs involves entering options in the same Create New Parameters dialog box that you saw when we were discussing static parameters. The difference being that instead of choosing the Static option you will now choose the Dynamic option. And when you do so the dialog box changes to reflect new options.
Creating a parameter that uses DCPs has the same steps that you’ve already practiced earlier in the chapter. Create a new parameter by right-clicking on the Parameter Fields node in the Field Explorer and selecting New Parameter. Then enter the parameter name and for the List of Values option select Dynamic. Notice that I had you skip the step of selecting the data type. This is because with DCPs the data type is determined by the data type of the field you choose from the database. You don’t get to select the data type.
By selecting the Dynamic option, the dialog box immediately changes to reflect the new requirements for inputting DCPs. The data type option become grayed out, a new Prompt Group Text input box is displayed, and the area of entering default values changes so that you can select a data source and pick the fields to display.
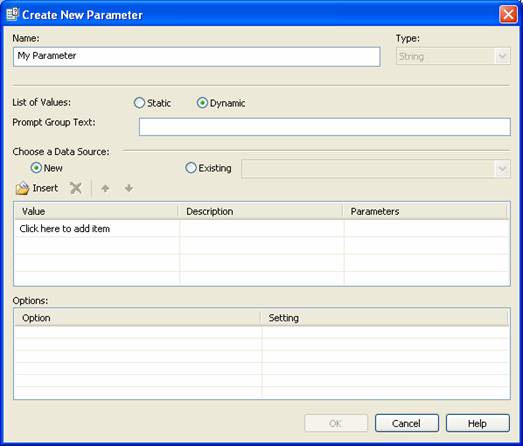
Figure 4-xx. Creating a new parameter using DCPs.
The Prompt Group Text input box displays the overall question that the user is presented with when they are going to enter in the parameter data. If this is a cascading parameter then it’s important to enter a question that clearly conveys to the user that they will be selecting from multiple lists before getting to the final one.
The option to Choose a Data Source is where you select which fields will be the data source for the list of values. They display the data for the user to choose from. By keeping the default option of New selected, click on the Insert button and it displays a list of the fields in the report’s data source. You are not allowed to create a new data source so that you can use fields that are outside of the report’s data source. You have to select a field that is in a table already referenced by the report.
Tip
If the table you need isn’t being used by the report, you can always click on the Cancel button, modify the report’s data source to include the necessary table, and then create the DCP again so that it can use this new table as its data source.
When selecting which field to display, it’s important to choose the proper table. As we discussed earlier in the chapter, some tables have a complete list of all the available values and some tables only show the values that have been selected as part of another record. This second list is most often incomplete. For example, the Customer table will list every customer your company has. But the Invoice table will only show customers with a current invoice on file. Which table you choose has a big impact.
For example, if you select the Customer table then the user will be able to see and choose from a complete list of customers. But this list could be quite large and it will take longer for the user to find the customer they want to print. Selecting the Invoice table makes it easier for the user to choose a customer because the list will have fewer entries. However, the user might still want to see the customers with no current invoices so that he can print a report that shows the user had no activity for the month. This can be just as important as showing which users do have activity. If you would have only shown the list of customers with current invoices then this wouldn’t be possible.
Another possible point of confusion is that if you select the Invoice table then some users might get confused when seeing that a certain customer isn’t in the list. They might wonder if a customer is no longer working with the company or if it’s a new customer then they might question whether the report has all the current data. So you have to consider the goals of your user before deciding which table will populate the list of values with. Again, a properly phrased Prompt Group Text can help prevent any possible confusion from your users.
After selecting the field for populating the list of values, you can also select a field for showing a description within the list of values. Displaying a description is useful for fields which wouldn’t make sense to the layman. For example, rather than displaying a cryptic Inventory Id, you could display the Inventory Name field as the description and the user will immediately know what inventory item to choose.
The last column is the Parameters column. This is used so that you can create a parameter to reference the user’s choice. This is important for cascading prompts because the primary purpose of cascading prompts is to make the last prompt in the list a more manageable size so that the user only sees the valid values. This implies that the only prompt that would be used on the report is the last prompt. Thus, only the last prompt needs to have a parameter field associated with it so that the report can be filtered on it. However, this isn’t always the case. There are times when the report will need to reference every value that the user selected within this prompt group. For example, if the DCPs use the following order of fields: Country -> Region -> City, then it’s very likely that in addition to filtering on the City selection, the report will also print out which Country and Region the user selected as well. You need to have a parameter associated with each prompt level to achieve this.
By clicking on the third column, the text within the cell changes to [?] My Parameter and a parameter is automatically created to store the value that the user selected with this prompt. If you decide later to not use a parameter then you can click on the cell again and it removes the parameter.
If you enter a single prompt and stop there, then you’ve effectively created a dynamic parameter that is actively linked to the database. It doesn’t have the cascading property associated with DCPs. This is useful when you just want to create a single prompt but link it to the database so that the list of values is always current. This is a big improvement over the static prompts that you created earlier in the chapter.
But you can also enter more parameters and achieve the benefits that cascading prompts give you. Enter each additional parameter on a new row. Just like the other prompts, you can select which field is used for the parameter value and which is used as the description. For any prompt that you want to access within the report, then click on the third column to create a parameter for it.
Note
The last prompt in group must always be associated with a parameter. If you forget to click on third column to create a parameter for the final prompt, then Crytal Reports will do it for you when you click the OK button to save the parameter. This makes sense for two reasons. The first being that if you didn’t want to assign a parameter to any of the prompts then there would be no reason to create DCPs in the first place. And the second reason is that since the ultimate goal of DCPs is to create an optimized list of values for the last prompt, then this is obviously the prompt you will want to use in the report.
After entering all the prompts for the parameter, you can set the options in the grid at the bottom of the dialog box. These options are the same as what was already discussed for static parameters. They let you set the whether it stores discrete or multi-value parameters, allow range values, etc. What makes these options unique is that each prompt gets its own set of options. If you remember from the discussion of static parameters, the options normally apply to the current parameter. But since DCPs create a prompt group within a single parameter, this is almost like having multiple prompts. Thus, the options are assigned to each prompt. That means that the first prompt could be a discrete value and the second prompt could be restricted to a multi-value.
Crystal Reports lets you create sophisticated prompt groups by combining a combination of parameter options with each prompt group. But you need to understand how these features work together and what the limitations are. The first thing to be aware of is that not every option is available for each prompt. The final prompt always gets access to all the options. But the prompts that are prior to the final prompt must be discrete values. You can’t enter range values. However, you are allowed to have multiple values associated with each prompt. In summary, all prompts prior to the final prompt can set all the options except for allowing range values. The final prompt is allowed to use range values. Figure 4-gg shows a prompt group using the fields Region and City.

Figure 4-gg. Setting options for the first prompt in a prompt group.
Caution
There is a strange behavior with DCPs that isn’t applicable to static parameters. After you click the Ok button and save the DCP, you can’t go back and edit the fields associated with each prompt. You are literally locked into using those fields with that prompt group. If you wish to change the fields associated with the value or description then you can’t do it. Instead, you have to click on the New option and rebuild the list of prompts from scratch. Fortunately, you are allowed to modify the options associated with each prompt but that is all.
The way that cascading prompts work together is that when you select a value from the first prompt, Crystal Reports queries the database for all the records that have that value in them and uses this list of records to populate the next prompt list. This is repeated for each prompt in the group until you get to the last prompt. At which point the last prompt the list should be fairly small depending upon how much filtering was done prior to it.
As an example, assume the first prompt is Country and the
second prompt is Region. If you select
DCP Performance Issues (Must
review with CR Tech Support first)
The benefit of DCPs can also be their biggest
drawback. You need to be aware of how DCPs affect report performance so that
you know how to use them appropriately. The most important thing to know about
DCPs is that every time a prompt is shown to the user then the database is
queried to get the list of values. If a report uses a lot of DCPs then this can
be a lot of activity for the database server. If the list of values is
relatively small (less than a few hundred items) then this won’t have a
significant impact. But if the list is considerable larger then this could
effect report performance as well as affect others who are using the database
at the same time.
From a practical standpoint most DCPs aren’t going to
have a large number of items. After all, don’t forget that the user has to
search through the list to find the value they need and you don’t want to
overwhelm them with too many items. So if your prompts only have a small number
of items then the impact on the database server will be trivial. But another
thing to consider is how many DCPs a report has. If a report has a lot of DCPs
and this report is used by a large number of users throughout the organization,
then too much usage of DCPs can impact the database.
Tutorial 4-5. Creating DCPs
The previous tutorials in this chapter have focused on different ways to modify the Group.rpt sample report and customize it with parameters. Well, this last tutorial is no different. It builds on the other tutorials by showing you how to use DCPs to create the same parameters and see how it makes them more user friendly.
The previous tutorials created a parameter for each of the
fields Country and Customer Id. They used the database tables to build a static
list of values that the user chose from. The only downside to doing it this way
is that the list of customers to pick from was quite large. Even though the
user could only choose to print the customers from either the
We’re going to slightly modify the report requirements to illustrate the usage of DCPs. The report will now let the user print the report for one or more customers and the user will narrow down the list of customers to pick from by first picking the Country. Once they pick the Country then only the customers located in that country will be displayed. This makes your report more user friendly.
1. Open the Crystal Reports sample report Group.rpt. Save it as Tutorial DCPs.rpt.
2. Right-click on the Parameter Fields list and select New.
3. Enter the parameter name Customers to print.
4. Select the Dynamic option.
5. For the Prompt Group Text type in Select the customers to print.
6. Click on the Insert button and select the Country field. Leave the Description and Parameters column alone because they aren’t needed.
7. We want to let the user enter customers from more than one country. In the Options, set the option Allow Multiple Values to True.
8. For the second field select Customer Id and for the description field select Customer Name. Click on the Parameters column so that a parameter is created for this field.
9. We want to let the user print multiple customers as well. In the Options box, set the option Allow Multiple Values to True.
10. At this point two prompts have been created and the final prompt saves the Customer Id field to the parameter. Click the OK button to save the parameter.
11. Now we want to set the record selection formula so that it filters on the Customer Id parameter. Select the menu items Report | Select Expert.
12. When the Choose Field dialog box opens, select the Customer.Customer Id field and click the OK button.
13. For the selection critieria choose Is Equal To.
14. For the field to match, choose the parameter {?Customers – Customer Id}.
15.
Click the OK button to save your changes. The
Enter Values parameter will automatically open. It should look similar to the
following figure.
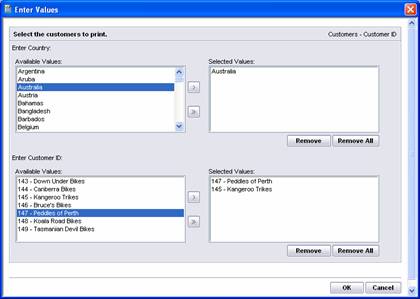
16. The first prompt lets you select multiple countries. As you choose each country the Customer list changes to reflect which customers are in that Country. Choose as many customers as you wish to print and click the OK button. You report is updated to reflect the customers you picked.
Advanced Tutorials
Tutorial 4-6. Selecting Records Using the ‘Or’ Operator
If you recall from the discussion about using the Select
Expert dialog box with multiple fields, Crystal Reports builds the selection
formula for you automatically. When there is more than one field used, each
field’s selection criteria must be met for the record to be selected. For
example, if the first criteria is Country=’
There will be times when your report wants to display that records that meet ANY of the conditions. If only one of the two conditions are met then the record should still be printed. To do this you have to use the OR operator to join the conditions.
For example, lets take the formula from Tutorial 4-1. When you clicked on the Show Formula button it displayed the formula
{Customer.Country} in ["
{Customer.Last Year's Sales} >= $25000.00
Notice the And operator at the end of the first line of code. Manually change the And to Or and save the formula. Now when you preview the report there will be a lot more pages. There will be a lot more records that only need to match one of the criteria rather than both.
The benefit to using the Show Formula button is that you can create very complex formulas for performing record selection. You can have formulas that use a combination of And and Or operators as well as using custom functions you created yourself.[8]
Be aware that once you enter a custom formula you can’t use the Select Expert prompts for moldifying the record selection anymore. Since your custom formula is too complex to be represented by the Select Expert then the prompts are disabled.
Tutorial 4-7. Mixing Static and Dynamic Parameters
In the discussion about DCPs I said that Crystal Reports
doesn’t allow you to mix static and dynamic parameters. If you want to use DCPs
then every prompt within the prompt group must be dynamic (pull its data from
the data source). The problem with this is that if you want to customize the
list of values presented to the user then you are limited to using the data
already in the data source. There are times where this isn’t going to work for
you. For example, in Tutorial 4-5, Creating DCPs, I wanted to demonstrate how
to recreate the earlier reports using DCPs. But the problem I ran into is that
in the earlier tutorials I only let the user pick from the countries
Command objects are discussed in more detail in Chapter X, but for now you just need to understand that a Command object is a custom SQL statement that you write manually. By getting creative with our SQL statements we can create filter out data we don’t want from the list of values before it is shown to the user. Very cool!
There are two criteria for using a Command object with DCPs.
1) All levels for the entire DCP must be derived from a single Command object. Each field in the DCP must come from this one Command object.
2) The Command object must not be linked to the other tables in the report. It has to be completely independent of the report data.
To create a Command object, select the menu items Database | Database Expert. Find the database and click Add Command. This opens a text area where you can type in your SQL statement. After you type in the SQL statement click the OK button to save it. You can now reference the Command object from your DCPs and use it as the source for the list of values.[9] The one thing to be careful of is that Crystal Reports will try to link the new Command object to an existing table in the data source. If this happens then delete the link. You want the Command object to be totally independent of the other tables. The second thing that will happen is that Crystal Reports will give you a couple warning messages that it doesn’t recommend using tables that aren’t linked to the other report tables. Just ignore these messages and click OK a couple times to make them go away.[10]
To solve the problem I had in Tutorial 4-5 where I just
wanted to list the countries
Select Country, [Customer Id], [Customer Name] FROM
Customer WHERE Country IN (''
In this SQL statement I select the three fields that are
used by the DCP prompts. I use the WHERE statement to specify that I only want
to see the countries
Caution
You have to be careful when using Command objects so that you don’t accidentally select a field from the report’s data source instead of from the Command object. The reason this is easy to do is because the Command object will have the same fields used in the report and the Command object is always listed at the bottom of all the fields to choose from. Thus, you can mistakenly pick a field from the report’s data source since those fields are listed first. DCPs do not support mixing fields from the live data source along with fields from the Command object. If you find that the list of values in your DCP is missing data or it looks unusual then go back and make sure that you only picked fields from the Command object.
Tutorial 4-8. Adding “ALL” to the List of Values
When using the Select Expert for filtering report records it forces the user to either enter a single value to filter on or pick from a list of values. The problem with this is that sometimes the user will want to print every record in the data source but they can’t because the selection formula doesn’t account for this. You need some way to let the user specify that they want to print all the records when the need arises.
You can use Command objects with DCPs to create a list of values that has the word “All” at the beginning of each list. This lets the user choose the “All” value when they want to print every record or they can pick any other value to filter the list by that value. The Crystal Reports sample report, “Prompting.rpt” shows us exactly how this is done. Let’s examine it to see the details.
Open the report “Prompting.rpt” found in the Crystal Reports Samples folder. After it opens click on the Refresh Report button and select the option to prompt you for parameters again. You’ll see that each prompt has the value “All” as the first item in the list. As you select different values for each prompt you’ll see that each successive prompt still lists “All” as the first item in the list of values.
Now that you understand how the DCPs work from the user’s point of view, let’s look behind the scenes to see how the report was built. First click on Database | Database Expert to view the data source. Find the Command object GeographyPrompt and right-click it and select View Command. It uses the following SQL statement:
SELECT Country, Region, City FROM Customer
SELECT Country, Region, '...All' FROM Customer
SELECT Country, '...All', '...All' FROM Customer
SELECT '...All', '...All', '...All' FROM Customer
The first SELECT statement in the SQL statement selects a complete list of every value for Country, Region and City. The second SELECT statement selects a complete list of every value for Country and Region but for the City it substitutes the word “All” in each record. This makes it possible for the user to see the word “All” in the list of values no matter which combination of Country and Region was selected. The third SQL statement does the same for every possible Country value. The last SQL statement uses “All” for each field so that the user can pick “All” for every prompt in the DCP.
It’s important to use the UNION keyword between each SQL statement. This keyword lets you combine multiple SELECT statements into a single resultset. This makes Crystal Reports think it is reading from a single table when in reality it is a table consisting of multiple groups of data.
Notice that each “All” value is preface with “…” This is to make sure it appears as the first item in each list of values. Since the list of values is sorted alphabetically, the “…” forces it to the top of the list.
After creating the Command object that builds the list of values for each prompt, you need to create a record selection formula that selects every record when the user selects the “All” value. Click on the menu items Report | Selection Formulas | Record. This opens the Formula Workshop dialog box. The selection formula is as follows:
if {?Country} = '...All' then
{Orders.Employee ID}={?Employee}
else if {?Region} = '...All' then
{Orders.Employee ID}={?Employee} and
{Customer.Country} = {?Country}
else if {?City} = '...All' then
{Orders.Employee ID}={?Employee} and
{Customer.Country} = {?Country} and
{Customer.Region} = {?Region}
else
{Orders.Employee ID}={?Employee} and
{Customer.Country} = {?Country} and
{Customer.Region} = {?Region} and
{Customer.City} = {?City}
This selection formula looks at each parameter value and determines if it is equal to “All”. Depending upon which parameter this applies to it sets the other fields to match their respective parameter field. It does this in a tree-like manner where it starts at the least restrictive level and works its way down through the more restrictive levels. This results in the report only filtering on the fields that do not have the value “All” selected for them.
Tutorial 4-9. Customizing the Enter Values Parameter Interface
In an effort to make Crystal Reports accessible for all people regardless of disability or impairment, the Enter Values dialog box is fully customizable. This enables you to make it easier for all your users to enter parameter values for a report. You can increase the size of the text, change the background color, and make a plethora of other modifications. But just because this was done for the purpose of making your reports accessible, that doesn’t mean you can’t use it just to make them look better. In fact, you can customize the Enter Values dialog box so that it matches your corporate identity.
The user interface for entering parameters is designed with HTML and CSS (Cascading Style Sheets). If you are familiar with website design then you know that CSS files let you centralize the look and feel of your website within a single text file. Each web page references the same CSS file so that they have a consistent format with a minimal amount of work. That same logic is used with the Enter Values dialog box.[11]
Crystal Report uses the file “promptengine_default.css” as the template for displaying the Enter Values dialog box. That file is located in the following directory (assuming you performed a default installation):
C:\Program Files\Common Files\Business Objects\3.0\crystalreportviewers11\prompting\css\
This file is a basic text file that can be opened any text editor or your favorite CSS editing program. Here are a few lines of sample code from that file.
.pePromptMessage
{
color: black;
font-family: Arial, verdana;
font-weight: bold;
font-size: 8pt;
}
.pePromptTextBox
{
font-size: 8pt;
background-color: #FFFFFF;
font-family: Arial, verdana;
width: 300px;
}
This book isn’t going to teach you CSS techniques, but the basic idea of this code snippet is that it defines how to display the prompt message and the prompt text box. It defines the font color, font size, and font style. If you modify this text file and save it, you’ll immediately see the changes next time you enter parameters in a report. Let’s walk through the steps for making some simple changes to this file and see what the effects are.
Note
The changes you make to the CSS file are not report specific. Since the CSS file is external to the report files, the changes you make to the Enter Values dialog box will be visible on every report. If the report is opened on a different computer, the Enter Values dialog box have the same properties as when Crystal Reports was installed. If you want other users to have the changes applied on their computer then you have to copy your new CSS file over the one on their computer.
To modify the CSS file, open the Windows Explorer and
navigate to the folder:
C:\Program Files\Common
Files\Business Objects\3.0\crystalreportviewers11\prompting\css\
Right-click on the file “promptengine_default.css” and select Copy.
Right-click anywhere in that window and select Paste. This makes a backup copy of your CSS file. You MUST make a back-up copy because what we are doing is only for training purposes and you will want the original file restored after we are finished.
Click on the Start menu and select All Programs | Accessories | Notepad. Click File | Open and navigate to the CSS file and open it.
Scroll through the file and look at the different options you have for changing the format of the Enter Values dialog box. Some of it may appear cryptic, but it shouldn’t be too hard to figure out because they are named very descriptively.
Let’s make a couple changes and see what the results are. Find the style .pePromptElementText near the middle of the file. Double the font-size property from 8 to 16. Find the style .pePromptRuler and change its height property from 1px to 20px.
Did you really create a backup copy of this file in Step 3 like I suggested? If you did, then save this file. If not, this is your last chance to make a backup copy before overwriting it!
After saving the changes open any report with parameters and refresh its data. You’ll see something similar to the following screen shot.

Notice how the prompt text is twice as large as the rest of the text? That is because we doubled the font size. And the gray bar separating parameters (the ruler) is huge compared to the thin line it used to be. Of course, I used these specific changes because they are easy to illustrate in the book, but they aren’t very practical. If you wish to modify the Enter Values dialog box for your own reports, then you should get a book on CSS to make sure you have a basic understanding of what you are doing. It isn’t very hard to change the fonts and color scheme to give it your own personal touch or make it match your corporate image.
Tip
If you are making a lot of changes to the CSS file and going back and forth to see how the changes affect the dialog box, then just press the F5 key in the dialog box. It automatically refreshes the interface to reflect the latest changes saved to the CSS file. This is much easier than refreshing the report data and reopening the Enter Values dialog box each time to see the changes.
After playing around with these changes you’ll want to go back to the folder and delete this current CSS file and replace it with the backup copy you made earlier.