Chapter 3
Sorting and Grouping
After leaning the basics of creating simple reports, you will quickly find yourself developing reports that are more involved then just listing sequential records one by one. For reports that consist of dozens, if not hundreds, of pages, providing a meaningful format that groups the data into logical units goes a long way towards making reports easier to read. Crystal Reports makes this possible by giving you the ability to sort and group data. Grouping reports also gives you the ability to create drill-down reports. This chapter starts out by showing you the simple task of sorting records and then builds on that knowledge by creating groups and customizing them.
Sorting Records
Being able to sort records in
either ascending or descending order is a fundamental reporting skill. Sorting
makes it easy for a user to quickly find a particular piece of data buried
within a large report. For example, when you use the phone book to look up a
phone number, it would take a long time to find a name if they weren’t listed
in alphabetical order. The same applies for the reports you create. Figure 3-a
shows a report sorted by
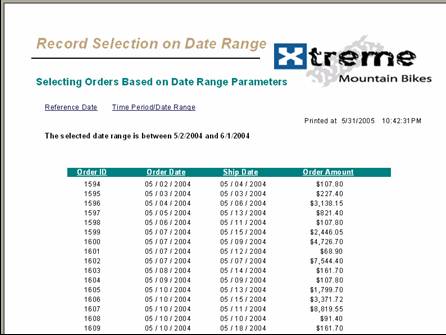
Figure 3-a. Sorting by
Controlling a report’s sort order is done with the Record Sort Expert dialog box shown in Figure 3-b. It gives you all the options necessary for selection the fields to sort and choosing their sort order. To use this dialog box, select the menu items Report | Record Sort Expert. You can also click on the Record Sort Expert button on the Experts toolbar.
![]()
Figure 3-aa. Record Sort Expert button.
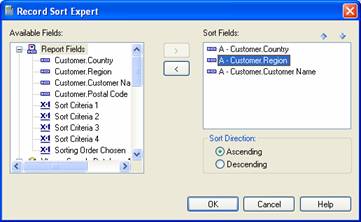
Figure 3-b. The sort order dialog box.
On the left side of the dialog box are the available fields. The fields are categorized by which fields and formulas are currently being used on the report (since that is most likely your first choice) and after that are all the available fields in the database.
Reports can be sorted on a single field or on multiple fields. Sorting on multiple fields is only useful when the sort field has duplicate values in it. To resolve which one should be listed first, the value in the second field is used to resolve the conflict. An example of this type of report is an employee report that sorts by name. The first sort field is the last name. When there are duplicate last names, the second sort field, the first name, is used. When sorting on multiple fields, you have to specify the order that the fields get sorted in.
To select a field for sorting, either drag and drop it onto the Sort Fields window on the right or click on the arrow buttons to move it over. The order in which you add the fields determines which one gets priority in the sort order. The first field listed becomes the primary sort field. The next field is the secondary field, and so on. When there are duplicate values in one of the fields, then the next field on the list is used to resolve the conflict. This continues for all the sort fields whenever there are duplicates. If a field has a duplicate value without another field after it, then the one that gets listed first isn’t always predictable.
The bottom of the dialog box is where you set whether the field is sorted in ascending or descending order. There are two radio buttons that set the sort order and only one can be selected at a time. Since there multiple fields can be shown in the Sort Fields list and there is only one place to set the sort order, both radio buttons apply to the currently selected field. To set the sort order of a field, first click on the field you want and then click on the sort order.
Let’s look at the example sort order shown in Figure 3-c. The primary sort field is Country. The secondary field is Region and this is followed by the Customer Name.
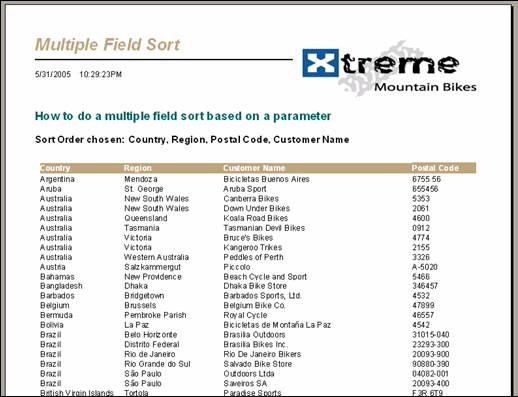
Figure 3-c. Sorting records on Country, Region and then Customer Name.
The report first lists all the countries that start with
the letter “A”. The country
If you later determine that you need to change the sorting order, modify it using the same steps mentioned earlier.
Grouping Records
When a report has a lot of pages, it is sometimes hard to quickly get a general idea of what the report is telling you. Sorting the data helps you find a specific record, but it doesn’t help give you high-level summary of what the data means. Grouping records lets you summarize data in a way that the reader gets a quick overview of the report.
Creating groups is one step beyond basic sorting. Groups lets you create categories to visually organize the records. They summarize the data based on critical fields and perform summing operations on the data within each group. If you need to see more information you can explore the detail records that make up the group.
Sorting records in a report results in the records being ordered differently than their natural order, but it doesn't have any effect on how the report is structured. Grouping is different because it creates new sections in the report’s design and organizes the data based on the new sections. For every group added to a report there are two sections created: the Group Header and the Group Footer.
The Group Header and Group Footer sections are the dividers between the data that goes into each group. They let you show group specific report fields, formula fields and summary fields to the report. You can also format the fields differently so that they stand out from the detail records. For example, it’s common to make fields in the header to be a different font (possibly bold) and in the footer it’s common to show sub-totals. The footer is also beneficial because the reader can understand the data by looking at the sub-totals without having to read every line. If you don't need to display the group header or footer, they can be hidden.
Adding and Customizing Groups
Just like sort fields, multiple fields can also be used for creating groups. Each field is given its own group header and footer. An example of grouping on one field is a sales report that groups the sales people by their territory. If there are a lot of sales people within each territory, then you could add additional groups such as product category and sales manager. Each group added to the report categorizes the data to make it easier to quickly find what you are looking for.
To add a new group to the report, select the menu items Report | Group Expert. This displays the dialog box shown in Figure 3-d.
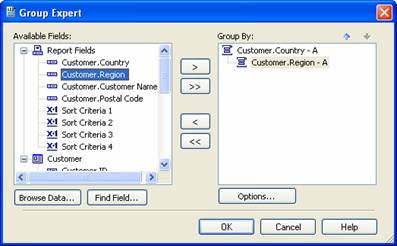
Figure 3-d. The Group Expert dialog box.
You can also show it by clicking on the Group Expert button on the Experts toolbar.
![]()
Figure 3-dd. The Group Expert button.
The Group Expert has a lot in common with the Record Sort Expert. The left side shows the fields that available for grouping and the right side shows the fields that have been selected. Move fields between the two sides by dragging and dropping them or by clicking on the arrow buttons.
The Group Expert has some new features that weren’t included in the Record Sort Expert. It lets you preview the current data in a field as well as search for field names within the available fields list. Clicking the Browse Data button at the bottom of the dialog box opens a new dialog box that shows the data for the currently selected field. Scroll through this list to verify that this is the data that you want to group on.
Tip
If you have a Memo field in your report, you might notice that it isn’t included in the list of available fields for grouping. That’s because Crystal Reports doesn’t allow creating a group on a Memo field. The same rule applies for sorting records – not allowed for Memo fields. As a workaround, create a formula based on the Memo field and then you can sort and group on the formula field. The formula can return the full Memo field unchanged or it can parse part of it if you just want to work with a portion of the data. Although the formula returns the exact same data as the original Memo field, Crystal Reports now lets you sort and group on it.
The Find Field button lets you search for a field in the list of available fields. This is useful for data sources that have many fields and you can’t quite remember the name of the field you want. By clicking the Find Field button you can type in part of a field name and it will find the field that matches what you entered.
Note
The Find Field button doesn’t have a Find Next feature. Once it finds the first field that matches your text then clicking on the Find Field button won’t search any further. It just stays on the same field. To make it search the rest of the list, you have to manually click on the following field before clicking the Find Field button again.
Tutorial 3-1. Creating a grouping report
To practice working with groups, let’s modify the Employee List report created in Chapter 1. The report lists each employee on a line and we are going to modify it so that it first groups by the region and then by the city. Within this grouping it sorts by last name.
1. Open the Employee List report you created in Tutorial 1-1.
2. Select the menu items Report | Group Expert. This opens the Group Expert dialog box.
3. In the Available Fields list click on the Employee_Addresses.Region field and drag it to the Group By list.
4. Click on the Employee_Addresses.City field and drag it to the Group By list.
5. Click the OK button. The dialog box closes and the two groups have been added to the report.
6. In the report designer, move the report object Group #2 Name a little to the right so that it is offset from Group #1 (the Region).
7. Click the OK button to save your changes. Your report’s design should look similar to Figure 4-e. The report preview is in Figure 4-f.
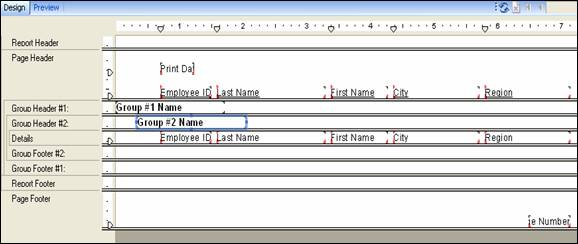
Figure 4-e. Employee List with groupings.
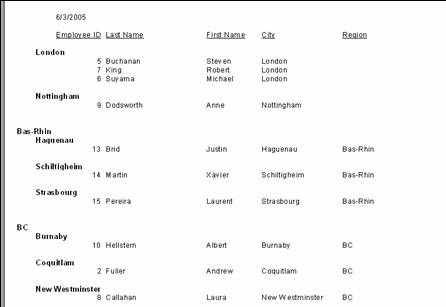
Figure 4-e. Employee List preview.
One unusual aspect about this report is that the first few
records don’t have any data in the Region field and all you see are the two
cities listed (
Navigating Groups
Adding groups to a printed report makes it easier to flip through the report and get a quick overview of the report’s information. But previewing a report within the Crystal Reports software is even easier to work with. To the left of the preview window is the Group Tree window which lets you navigate to each group as well as the sub-groups.
The Group Tree is toggled on and off by selecting View | Group Tree or by clicking on the Toggle Group Tree button on the Standard toolbar.
![]()
Figure 4-ff. The Toggle Group Tree button.
By default only the top-most groups are shown. When you click on the group name the report immediately jumps to the page that has that group on it. If there are sub-groups, then a plus sign is shown next to the group name. Click on the plus sign to expand the group and list the sub-groups below it. You can also double-click on the group name to expand it. Clicking on the sub-groups has the same effect of jumping to the page in the report where the sub-group is located.
When you move the cursor over a group header and it becomes a magnifying glass, you can double-click on a group heading and it opens the group in its own tab. This lets you review the group data separately from the rest of the report.
Formatting Groups
The default layout for groups is that they print one after the other. When a group footer is printed, the subsequent group’s header is printed right after it. Some report requirements require changing this default behavior. For example, an invoicing report is designed such that it is grouped by client and each client gets their own invoice. For this report you will put the client information in the group header section and force the group header to be printed at the top of a new page. The summary values appear at the bottom of the page. The group footer is set to always print at the bottom of the page.
The formatting options for groups are in the Section Expert. The Section Expert is discussed in detail in Chapter 8 but for now we are going to look at which options are beneficial for using with groups.
To get to the Section Expert dialog box, right-click on the group section and select Section Expert. This opens the Section Expert dialog box which lists all the sections along the left side and the section properties are listed to the right. The properties of interest here are Print at Bottom of Page, New Page Before, New Page After, Reset Page Number After, and Keep Together.
Print at Bottom of Page
This forces a section to always print at the bottom of the page even if the detail records stop printing in the middle of the page. This is commonly set for the Group Footer section. It is useful for reports that print summary information (sub-totals, disclaimers, logos, etc.). It is also useful for form letters where the bottom of the page must have exact placement.
New Page Before / New Page After
These two properties are used to force the groups onto individual pages. This is so that you can split the reports apart and distribute them independently. For example, a report grouped on Employee Id can be broken apart and each employee can be given their own report without seeing any information about the other employees.
You can either set the New Page Before property for the Group Header or set the New Page After property for the Group Footer. Both give you the same results of splitting the groups onto separate pages. The only problem is that sometimes these options cause a blank page to be printed either at the beginning of the report or at the end of the report. I address this more fully in the Advanced Tutorials section because it requires writing formulas.
Reset Page Number After
This sets the page number back to 1 after the Group has been printed and is usually associated with the Group Header. It insures that the page number for each group starts at 1. Just like the New Page Before property, this is useful for reports that are separated and distributed.
Keep Together
The Keep Together property forces a section to stay on the same page. For example, if the Group Header has the Keep Together property enabled and the entire header can’t fit on the page, then it will be started at the top of the next page. The important thing to note is that this only applies to an individual section and it won’t take other sections into account.
The Keep Together property may cause a little confusion because there is another property which has similar characteristics and also has a similar name. It is the Keep Group Together property. Let’s look at what each property does and how they differ.
The Keep Group Together property looks at the entire group (its header, details and footer) and tries to keep them on the same page. If the entire group can’t fit on the remainder of the current page, then the group is started at the top of the next page. This is clearly different than the Keep Together property because it only applies to a single section and the Keep Group Together property looks at multiple sections.
It’s important to note that the Keep Group Together property is in a totally different dialog box than the Keep Together property. The Keep Group Together property is in the Change Group Options dialog box (select Report | Group Expert | Options).
There are some rules associated with the Keep Group Together property. If a group starts in the middle of a page and it can’t be fully printed by the end of the page, then it starts printing at the top of the following page. If a group requires more than a full page to print, then it will start printing at the top of the following page and continue onto the next page. The Group Header will not be printed on the additional pages unless the property Repeat Group Header on Each Page is set (also in the Change Group Options dialog box).
Advanced Grouping Options
The majority of the time that you add a group to a report you just need something simple that displays the group name and sorts it in ascending order. This is the default behavior when you add a group to the report and nothing additional is required. But there are times when you need to customize the group such as changing the sorting order, overriding the group name field, and setting how the group headers are displayed. Making changes like as these, and more, are available within the Change Group Options dialog box.
On the Group Expert dialog box there is an Options button located at the bottom right corner. Clicking on the Options button opens the Change Group Options dialog box where you set the advanced grouping features.
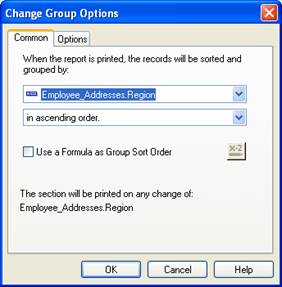
Figure 3-gg. The Change Group Options dialog box.
The Change Group Options dialog box has two tabs: Common and Options. The Common tab sets the field being grouped on and the sorting order. The Options tab customizes the group name and how the group is displayed.
Clicking on the Options button lets you modify the grouping properties of the field currently selected on the Common tab. Make sure you have the proper grouping field selected before clicking the Options button.
Selecting the Grouping Field
The top dropdown on the Common tab selects the field the group is based on. Most likely you will leave this as is, but if you need to change the field that a group is based on then this is the place to do it. You can choose from a current field on the report, any fields in the current data source, or a formula field.
If the grouping field is a Date or Time data type, you have more options for how to group the records. A new dropdown box appears that lets you group on the specific part of the date or time (e.g. per week, month, quarter, hour, etc.)
Sorting In a Specified Order
The second dropdown box at the top selects the sorting order of how the groups are listed. With one exception, the sorting options are what you would expect and don't need any explanation. You can choose a sort order that is Ascending, Descending, Original Order (no sorting) or Specified Order. The first three options are straightforward, but the Specified Order option requires more explanation.
Specified Order means that you specify the exact order to display every value in that field. You manually go through each possible value and specify the order it appears on the report. If you leave any values out then they all get consolidated into a single group that appears at the end of the report.
Once you select the Specified Order option two new tabs appear in the dialog box: Specified Order and Others.
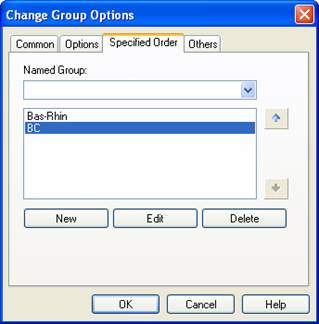
Figure 3-e. The Specified Order tab of the Insert Group dialog box.
The Specified Order tab is where you build the list of how the values are to be sorted. At the top is a dropdown box that lists all the possible values for the group field. Under the dropdown box is a listbox that lists which groups will be shown and their order.
There are two ways of adding items to the listbox: adding individual items or adding named groups (a sub-group). Adding individual items is the easiest method because you simply select a value from the dropdown box and it gets added to the list. The order that you add them to the list is the order that they appear on the report. If you want to rearrange where an items appears in the list, select the item to move and click on either the up or down arrows located to the right of the list to move it up or down in the list.
If you have a lot of possible values, adding them all to the list this could be very time consuming. For example, a sales report grouped by region would have a lot of values if it were for an international company. To make this a little easier, there is a faster way of adding items to the list.
The second way of adding items is by creating Named Groups that specify a range of values. It may be easier to think of this as a sub-group. Specifying a Named Group is done by specifying a lower and upper bounds for the range or building a formula using Boolean logic. Any value that falls within this range is included in the Named Group. This is obviously a faster way of adding the items because one sub-group can consist of many values. Named groups also give you a lot of flexibility because the formulas can be quite complex.
Note
The Specified Order tab lets you combine the display of individual values and Named Groups in the same report. However, if a value falls within the classification of one of the Named Groups, then it won’t be displayed individually. Otherwise that would result in showing duplicate data in the same report. This would give inaccurate information without the user realizing it.
To create a Named Group, click on the New button located below the list. This brings up the dialog box called Define Named Group. You can see in Figure 3-f that this is a fairly simple dialog box.
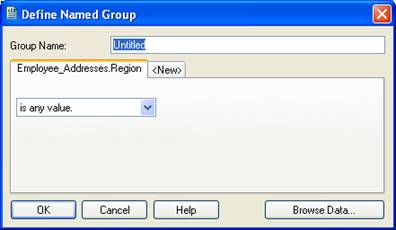
Figure 4-5. The Define Named Group dialog box.
Assign a name to the group in the top textbox. This name is what is displayed on the report in the group header. In the left dropdown box you specify how to filter the range of values. The dropdown box shows numerous ways to select a range of values. A few of these are Is Equal To, Is Not One Of, and Is Between. When you select one of these operators, the proper input controls automatically appear to the right of the dropdown box. The input controls change depending upon the information needed to complete the filter. There are so many different variations of filtering options and their associated input controls, that they won't be explained here. They are all very intuitive and you shouldn't have any problem entering the proper data.
Within a named group, you have the option of using more than one filter. By clicking on the <New> tab, you are shown the same filtering options as on the first tab. But now you can make new selections and the resulting values are also associated with the current named group. These filters are linked together using an OR operand. Thus, any of them can be true and the record will be included in the named group.
The last tab in the Change Group Options dialog box is the Others tab. It lets you decide what to do with the records that aren’t otherwise specified. Since it is possible that some reports won't need to specify how every value is grouped, this tab accumulates all the remaining values that didn't get included in one of the named groups. You have the option of discarding these records, accumulating them in a separate tab, or leaving them as their own groups.
As an example of when to use the Others tab, consider a company that has five primary products that generate over 90% of its sales and the remaining products produce an insignificant amount of revenue. In a sales report the five primary products will be listed separately and the miscellaneous products would be put into the Others group.
The Others group is also useful for reports that group on fields where the data is dynamic and new values are added after the report is created. If the new values don't fall within the current named groups, they get lumped in with the group called Others. To build on the previous sales report example, any new products that are sold by the company are automatically accounted for in the Others group because the sales for it will generally be small at first. Once the product becomes more popular and its sales become significant then a specified group can be added for it.
Figure 3-hh shows the Change Group Options dialog box with the Others tab shown.
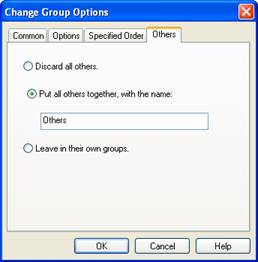
Figure 3-hh. The Others tab of the Change Group Options dialog box.
There are three options for handling how the Others group is handled. The first option is to discard the data. This is useful when the data is frivolous and you don’t want it appearing on the report. The second option puts all the values into a single group. The default value of this group is “Others” but you can type in a different name that is more appropriate. The third option is to leave the remaining fields in their own groups. They get displayed within the report as they normally would. This is useful when there are a lot of values that get their own group and it would be very time consuming to list each one in that box. Setting this property includes them in the report without you having to list them.
When grouping values into the Others group (or however you name it) it is always shown at the end of the report as the last group.
Customizing the Group Name
In most circumstances, the Group Name field displayed on the report is the fields’s current value. For example, if you are grouping by country, then the group name shown on the report is the current country name. If you don't want to display the current value as the Group Name, you have the option of displaying another value instead. For example, consider a report group that lists how many products were sold for each day of the month and it’s grouped by the Inventory Number field. If the report is intended for users who recognize a product's name, but not the inventory number, then displaying the inventory number in the group header isn’t a very good idea. It’s better to show the product’s name as the group name instead of the inventory number. The Options tab of the Change Group Options dialog box allows you to override the Group Name field with another field.
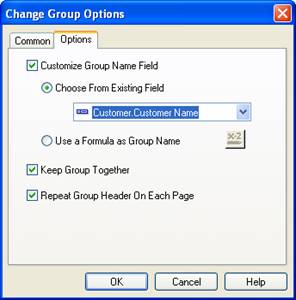
Figure 3-g. The Options tab of the Change Group Options dialog box.
The first checkbox, Customize Group Name Field, on the Options tab modifies the Group Name field. Click the option button Choose From Existing Field to use another field as the group name. Then select the field from the dropdown box below it. When the Group Name is displayed, the value from the other field is displayed instead.
There are times when the Group Name you want to display isn't a field in the table. It could be a custom formatting field where you join multiple fields together or where you parse text out of a field. To make the Group Name display a formula instead, click the option button Use a Formula as Group Name and then click the formula button. Formulas are covered in detail in Chapter 5.
Keeping the Group Together
The second and third checkboxes on the Options tab controls whether the report should try to keep the entire group on the same page. These properties were mentioned earlier in the Keep Together discussion within the Formatting Groups section. Setting the Keep Group Together checkbox is important if you want to prevent having only a few records of a group appearing at the bottom of a page. When this option is on, the entire group is analyzed before it is printed. If it can't fit on the rest of the page, then the remainder of the page is left blank and the group is started at the top of the next page.
The third checkbox, Repeat Group Header on Each Page, forces the group header to print at the top of every page. This is important for groups that can span multiple pages. By default, if a group extends to a second page then its header is not printed at the top of the second page. Most of the time the group header displays information that makes it easier to understand the meaning of the groups detail records (like the group name and column headers). If you feel that repeating the group header at the top of the page makes your report easier to read, then you should click this checkbox.
Sorting the Group Data
After creating the groups and running a test report, you may notice that although your groups are fine, the detail rows within the group are out of order. They might appear to be printed randomly or their natural sort order isn’t how you want it sorted. For example, in Figure 3-h the detail records are sorted naturally by Employee Id but you want them sorted by Last Name.
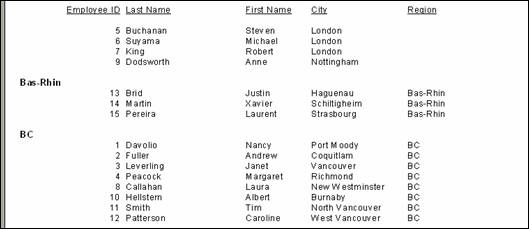
Figure 3-h. Detail records that aren’t sorted on the right field.
Telling the report how to group data doesn’t mean that it knows which fields to use for sorting the detail records within the group. Sorting the detail records is done separately. If no sort fields are used, then the records appear in their natural order. Sorting the records within the group is the same as adding a Sort Field for a report which was discussed earlier in the chapter. Just open the Record Sort Expert and add the sort field to the Sort Fields list.
It’s important to understand the differences between fields that are sorted within a group and fields that sorted within a detail section. The Record Sort Expert is strictly used for sorting detail records. It has no control over how the groups are sorted. That said, even though it doesn’t control the group fields, it still shows them in the Sort Fields list. For example, Figure 3-i shows a report that is grouped by Region and City and the detail records are sorted by Last Name.
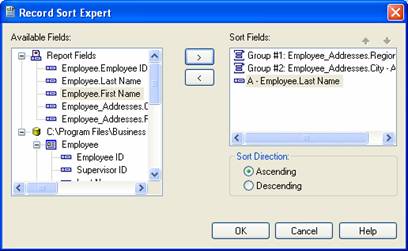
Figure 3-i. Record Sort Expert showing groups.
Notice that the first two sort fields are the two grouping fields. After that it shows the Last Name field. If you click on one of the two grouping fields all the buttons become disabled because you’re not allowed to change the grouping within this dialog box. If you want to change the group fields then you have to go back to the Group Expert to do so. The reason the group fields are shown here is because Crystal Reports wants to remind you that the group fields always take precedence for sorting and the detail records always come last.
Reordering the Groups
Sometimes you might create a report with multiple groups and then decide that groups should be rearranged. For example, a report that sorts first by state and then by product could be changed to sort by product first and then state. There are two ways to reorder the group fields. The first is to go into the Group Expert and use the arrows above the Group By list. Click on the field to change and click on the appropriate arrow to either move it up the list or down the list. The second way to reorder the group fields is by clicking on the Group Header on left side of the report and dragging it to the new position. This changes the mouse cursor to a hand and highlights the group that will be changed. This is illustrated in Figure 3-j.
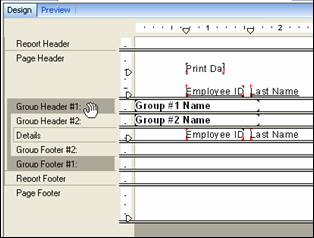
Figure 3-j. Dragging the group header to a new position.
Tutorial 3-2. Grouping by a Specified Order
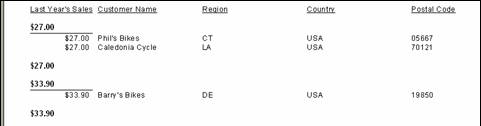
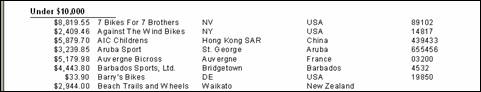
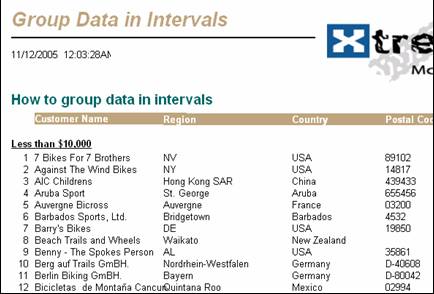
Crystal Reports has an excellent sample report that demonstrates how to create a grouping report using the specified order option. The report Group By Intervals is a sales report that shows total sales from the prior year for each customer. Each customer is broken down into three categories based on their sales volume: Less than $10,000, $10,000 to $25,000, and Greater than $25,000. Within each category the records are sorted by the Customer Name field. We’re going to see how this report works by creating the same report from scratch.
1. On the Start Page click Standard Report Wizard to create a new report.
2. In the Data dialog box, select the Xtreme.mdb database as the data source. Do this by clicking on Create New Connection | Access/Excel | Make New Connection.
3. For the Database Name property, navigate to the Xtreme.mdb database that is installed in the Crystal Reports sample folders. Click the Finish button once you’ve selected it.
4. Open the Tables node and double-click the Customer table to add it to the Selected Tables list on the right. Click the Next button.
5. In the Available Fields list, select the fields Customer Name, Region, Country, Postal Code, and Last Year’s Sales. Click the Next button to go to the Grouping dialog box.
6. In the Grouping dialog box, select Last Year’s Sales as the grouping field. The Grouping dialog box only lets you select the fields for grouping. It doesn’t let you set any of the advanced options. So we will have to wait till later before setting the specified order options.
7. Click the Next button to go to the Summaries dialog box. Crystal Reports saw that the field Last Year’s Sales was numeric and automatically created a summary field for it. This isn’t necessary for this example so you can delete it.
8. Click the Finish button to skip the rest of the Wizard’s dialog boxes and go to the report designer. Your report should look similar to the following.
The report is grouped last year’s sales and consequently there is a group for almost every record in the database. This isn’t very practical, so let’s clean it up by grouping the values into three categories.
9. Open the Group Expert dialog box by clicking on the Group Expert button or selecting the menu items Report | Group Expert. The field Last Year’s Sales is listed in the grouping fields on the right.
10. Click the Options button to open the Change Group Options dialog box. On the sorting property (the second dropdown box), select the In Specified Order option. This displays the Specified Order tab.
11. Click the New button to create the first group. This opens the Define Named Group dialog box.
12. Enter a name of Under $10,000. In the criteria dropdown box select Is Less Than. For the Value property enter 10,000. Click the OK button to save it.
13. Under $10,000 is now listed on the Specified Order tab. Click the New button to enter the second group.
14. Enter a name of $10,000 to $25,000. In the criteria dropdown box select Is Between. For the two Value properties enter 10,000 and 25,000. Click the OK button to save it.
15. For the final group, click the New button again and enter the name Over $10,000. For the criteria select Is Greater Than and enter a value of 25,000. Click the OK button to save it.
16. At this point you’ve created the three groups that will categorize the records. In some reports you would now go to the Others tab to tell Crystal Reports what to do with the records that didn’t fall into one of the groups. But in this example, all the records will be included in one of the three groups. Click the OK button to save your changes on the Specified Order tab.
17. As another option, you might want to list the customers with the most sales first. If so, you can re-order the groups on the Specified Order tab by selecting the group and clicking on the arrow keys to move it up or down in the list. For this example, we’ll just leave it as is.
As we learned earlier in the chapter, specifying the order of the groups doesn’t effect how the records within the group are sorted. We want the detail records to be sorted by Customer Name.
18. Open the Records Sort Expert dialog box by selecting the menu items Report | Record Sort Expert.
19. Double click the Customer Name field to add it to the Sort Fields list. Click the OK button to save it.
20. You’ve made all the changes necessary. Save it as Specified Order Tutorial.rpt and then preview it. If you page through it you’ll see that each group is in the order that you added them to the Specified Order tab and that the detail records are sorted by customer name. Your report should look similar to the following.
Displaying Top N Reports
An alternative to standard grouping is to create reports that show the first or last set of records in a certain group. For example, rather than showing all the sales people for the company, you could show the 5 sales people that have the best sales for the month. Or you can do the opposite and show the top 5 sales people with the lowest sales for the month. The first report shows who deserves a bonus and the second report shows who should be talked to about improving their performance. This type of report is called a Top N report.
Generating a Top N report has two requirements. The first is that your report must have at least one group in it. The second requirement is that the group must have a summary field in it (a sub-total, average, etc). The summary field is required because a Top N report uses this numeric value to calculate the ranking position of each group.
To create a Top N report, select the menu items Report | Group Sort Expert. You can also click on the Group Sort Expert button on the toolbar. If it is grayed out, then that means that the report either doesn't have at least one group section or it doesn’t have a summary field within that group. Correct this and it won't be grayed out any more.
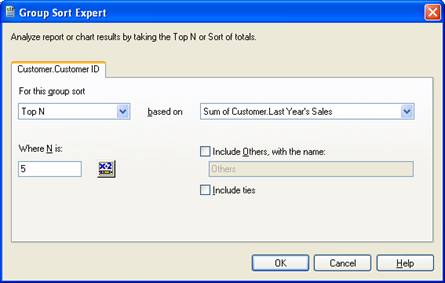
Figure 3-j. The Group Sort Expert dialog box.
Figure 3-j shows a single tab for the Customer Id field. But if the report has multiple groups with summary fields, then each group gets a separate tab. This gives you the option to create different Top N selections for each group.
When the Group Sort Expert dialog box opens the first property has a setting of All. This is because the group defaults to displaying all values. By clicking on this dropdown box, you can choose from a Top N, Bottom N, Top Percentage, or Bottom Percentage. This bases the calculation on either a certain quantity or as percentage of the total records. It lets you select which field to base the comparison on (this must be a summary field), how many groups to show and whether all the non-selected groups should be lumped into a final group called Others (or another name that you specify). If you want to select the number of groups based on the percentage of the total groups, then select that in the dropdown box and N will now represent a percentage.
One item of interest is the Include Ties checkbox. Select this option if you there is a chance that two or more groups will be tied for the same place. If this is checked then both groups will be displayed. If this box is not checked then only one of the groups will be displayed and the other won’t be shown. It is not possible to determine ahead of time which group will be the one displayed.
Grouping on Summary Values
The Group Sort Expert dialog box actually has a dual purpose. In the previous section I quickly skimmed over the fact that the dropdown box defaults to the value All so that all groups are displayed. But this setting is also useful for creating new ways of sorting your groups.
Normally, a group is sorted based on the Group Name field (as specified in the Change Group Options dialog box). However, the Change Group Options dialog box doesn’t give you the ability to sort groups based upon a summary value. For example, you might want to sort your customers based upon the total current year’s sales. The Group Sort Expert lets you do this by selecting a sort type of All and then choosing the summary value to sort on. Effectively, you are no longer sorting on a text field and instead sorting on a numeric field (the summary value).
The summary value to sort on is selected using the right-most dropdown box. Each summary field you select gets added to the listbox below it. You can change whether the field is sorted in ascending or descending order by clicking on it in the listbox and then selecting the sort order. By using summary fields to sort your groups, you get a lot more flexibility with how the groups get displayed.
Tip
If you decide to sort a group on a summary value rather than the group field, you should show the summary value in the group header. Otherwise someone reading the report will see that the values in the group field aren’t sorted and think that there is no organization to the report. By making it clear that the summary value is the sort field, then the reader will understand the significance of why groups appear first in the report.
Displaying Hierarchical Reports
A hierarchical report shows the relationship between records in the same table using a tree format. An example is an Organization Chart that uses the personnel table to display a list of its employees and their supervisors. Each employee has a record in the personnel table. But each employee also has a supervisor that they report to and that supervisor is in the same personnel table. Thus, there is a relationship between the employee and their supervisor and both entities come from the same personnel table. There are three requirements for using hierarchical reports.
1. A record has two fields that represent the same data. In the Org Chart the Employee Id is the key field for the record. Within the record is the Supervisor Id field and it points to a different record within the same table.
2. The report must be grouped on the child field (e.g. the Employee Id).
3. The parent and child fields must be the same data type.
Trying to figure out how to make an Organizational Chart using records that point back to themselves can get a little complicated. Rather than do the work yourself, let Crystal Reports do it for you. Open the Hierarchical Options dialog box by selecting Report | Hierarchical Grouping Options.
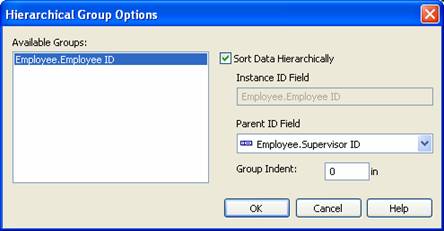
Figure 3-k. The Hierarchical Group Options dialog box.
This dialog box shows a list of all the groups within the report. The Available Groups list shows the current groups in your report. You can only create a hierarchical report using one of these existing groups. To use it for hierarchical grouping, click on group that uses the child field (e.g. Employee Id) and check the Sort Data Hierarchically checkbox. In the Parent Id dropdown box below the checkbox, select the field that will be the parent field (e.g. Supervisor Id). This establishes the relationship between the two fields and Crystal Reports automatically groups the records so that the parent records are shown before the child records.
The last option in the dialog box is the Group Indent value. This sets the indentation level between a parent record and its child record. The default value is 0.25 inches.
You need to be careful when formatting a hierarchical report for the first time. As mentioned earlier, the default format for printing is a tree-view format. The parent records start on the left-most side of the report and the child records are indented at each level.
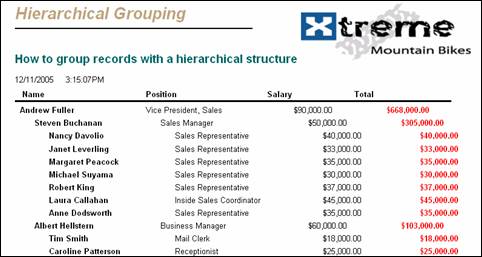
Figure 3-l. The Hierarchical Grouping report with indenting.
Shifting the columns to the right is fine when the columns are large (as in the above figure), but if the columns are small then there isn’t room for shifting then data can get pushed into the wrong column. If this causes a problem you can either make the Group Indent value small or just set it to zero. Setting it to zero insures that the data in each column is lined up exactly with the column header above. This looks the same as a typical report as you can see in the next figure.
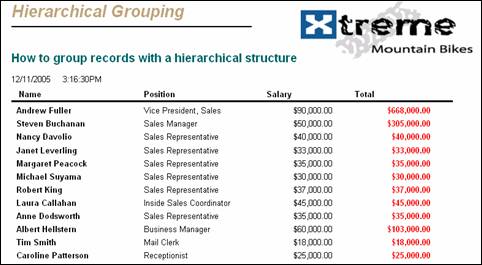
Figure 3-l. The Hierarchical Grouping report with 0 indentation.
Another option is to only indent the description fields and not indent the numeric values. This requires using advanced functions so the process for doing so is in the Advanced Tutorials section at the end of this chapter.
Drilling Down on Data
The nature of creating groups is to organize a lot of data in a report so that the reader can quickly find their data by scanning through the different groups. This lets the reader skip over the data that doesn’t relate to them and instead focus on what is important. But there is more to it than that.
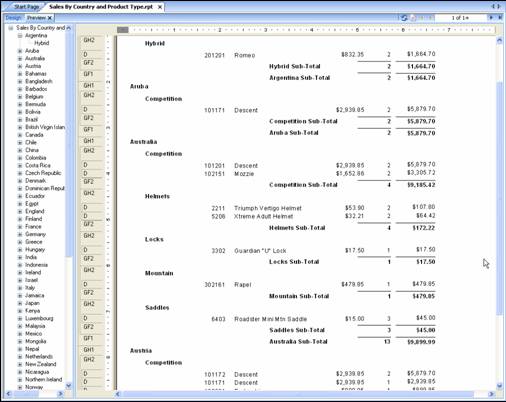
You can use groups to make report data dynamic for the user and allow them to drill down into the details of each group. Crystal Reports lets you double-click on a group header and open the detail information in a new window. This is called drilling down on data. It lets you just see the data for that group without worrying about the rest of the data on the report. For example, Figure 3-m shows a report grouped by country.
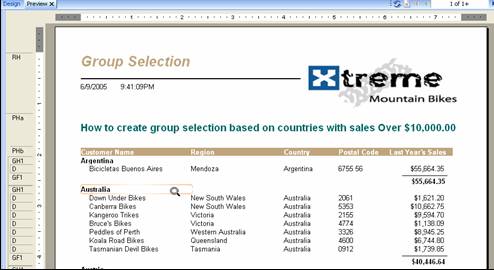
Figure 3-m. Grouping by country.
Notice how the cursor is positioned on the
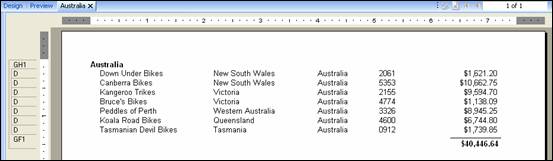
Figure 3-n. Drilling down into the
Notice in Figure 3-n that a new tab was created for
One drawback to drilling down on data is that only the data is displayed and no column headers are displayed (see Figure 3-n above). Thus, if you were to print this out and give it to someone then they would have to already know what each column represents. Otherwise they won’t know how to read the numbers on the page. One way to get around this is to put column headers in the group header section so that they get displayed with the drill down data.
Another feature of drill down reports is that the detail sections can be turned off. This lets the user only see the summary data when reading the report. If there is a section that they want to see the details of then they can double-click on the group header and the detail records are shown on their own tab. This gives you the benefit of creating a report that presents an overview of all the data with the option of seeing more details when necessary. Figure 3-o shows the same report modified so that the details are hidden.
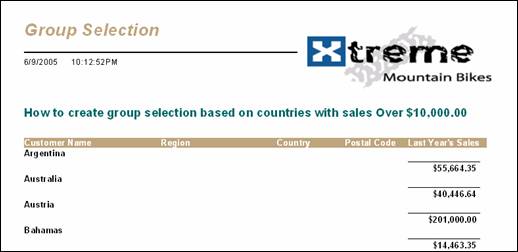
Figure 3-o. Group details hidden.
In this report only the group header and Last Year’s Sales subtotals are shown. The detail records are not visible. To see the detail records, double-click on the group header just like before and they will be displayed in a separate tab.
The group details can also be suppressed so that they can’t be viewed by anyone. This is beneficial when you want to distribute a report that has classified information in it but you don’t want to recreate the report from scratch just to hide the data. For example, you can give a manager a travel expense report that shows the manager the total expenses and how much was charged by each employee. You can also give this same report to others in the department to see the totals but you don’t want them to see the detail amounts. You can do this by giving the manager the original report and giving the others a copy of the report with the details suppressed.
Hiding and suppressing data can be set in two different ways. The easiest way use the pop-up menu by right-clicking the section in the shaded area on the left side of the report designer. The pop-up menu has the items for toggling the Hide and Suppress properties of the section. Click on the item you want to either enable or disable the property. The other way to set the properties is to select the Section Expert menu item from the pop-up menu and modify it via the dialog box.
Tutorial 3-3. Hiding and Suppressing Details
This tutorial walks you through the process of toggling the detail data on and off so that it can be drilled down into.
1. Open the report “Group Selection.rpt”. This is one of the example reports that was installed with Crystal Reports. It is located in the Feature Examples folder.
2. Right-click on the Details title along the left sidebar and select the Section Expert menu item. When it opens make sure that the Details section is highlighted on the left side of the dialog.
3. Under the Common tab click on the Hide checkbox (this checks it).
4. Click Ok.
Preview the report and you’ll see that the detail section is hidden. If you double-click on one of the group headers then it will open a new tab and show the detail records.
5. Go back to Design view.
6. Open the Section Expert again (see Step 2) and uncheck the Hide option.
7. Click on the Suppress checkbox so that it becomes checked.
8. Click Ok.
Preview the report and it looks the same as it did when the Hide option was checked. The difference is that if you double-click on the group header nothing happens. Since the details are suppressed you are not allowed to view them at all.
Summarizing Data
A major benefit to grouping data is that it lets you put summary data within the group footer and header. This is beneficial because when there are a lot of detail records you don’t want the reader to have to get out a calculator to calculate sub-totals and averages of columns. You want the report to do this automatically.
Crystal Reports gives you a multitude of functions for adding summary calculations to a report. Table 3-1 shows a complete list of the summary functions available.
Table 3-1. Summary functions for groups.
|
Function |
Description |
|
Average |
Calculate the average value. (2) |
|
Correlation |
Calculate the correlation of two fields. (1)
(2) |
|
Count |
Count the number of detail records. Fields
with NULL values are not included in the calculation. (3) |
|
Covariance |
Calculate the measure of the linear relation
between paired variables. (1) |
|
DisctinctCount |
Calculate the number of unique values for
that field. |
|
Maximimum |
Find the maximum value of all the fields. |
|
Median |
Return the middle value if all the fields
where sorted. (1) |
|
Minimum |
Find the minimum value of all the fields. |
|
Mode |
Returns the value with the most duplicates. |
|
Nth Largest |
Finds the largest value of all the fields
with a ranking of N. For example, if N were 6, it would return the sixth
largest value. |
|
Nth Most Frequent |
Finds the Nth ranking field with the most
duplicate values. For example, if N were 6, it would return the value with
the 6th most duplicates. |
|
Nth Smallest |
Finds the smallest value of all the fields
with a ranking of N. For example, if N were 6, it would return the sixth
smallest value. |
|
Pth Percentile |
Returns the value for the specified
percentile of the field. (2) |
|
Pop Standard Deviation |
Calculates how much a field deviates from the
mean value. (1) (2) |
|
Pop Variance |
Find the population variance of a set of
values in a report. (1) |
|
Sample Stanadard Deviation |
Return the sample standard deviation for the
field. (1) (2) |
|
Sample Variance |
Return the sample variance for the field. (1)
(2) |
|
Sum |
Return the total of all the detail fields.(2) |
|
Weighted Average |
Return the weighted average of all the detail
fields. (2) |
Chart Notes:
(1) See a statistics book for detailed calculation information.
(2) Can only be used for numeric data.
(3) NULL values can be included if you set them to return their default values. To do this, select the menu options File | Report Options. Then check the box for converting NULL field values to their default.
Note
Summary fields can be put in both the Group Header or Group Footer sections. It might seem strange that a summary field can be in the Group Header section since it is printed before the detail records are printed. But if you recall from Chapter 1, Crystal Reports uses a Multi-Pass process to build the data printed on a report. The summary fields are calculated in the first pass and are already known before any of the records are printed. That’s why summary fields can appear in the header as well as the footer sections.
To create a summary value for a group field, right-click on the field that you want to summarize and select Insert. The pop-up menu gives you the option of inserting a summary or a running total[1]. Each option gives you a different dialog box.
Inserting a summary brings up the dialog box in Figure 4-10. The top textbox shows the field you clicked on. Below that is a dropdown box that selects the summary function to perform. The third dropdown box tells where the field should go. If you put it in the report footer, then it is a grand total. If you put it within an existing group, then it is a sub-total. If there are no groups based upon the field you want to associate this summary field with, then click the Insert Group button and after you close the dialog box a new group will be created. Ideally, this won't be necessary because you will plan out your report so that it already has all the necessary groups created.
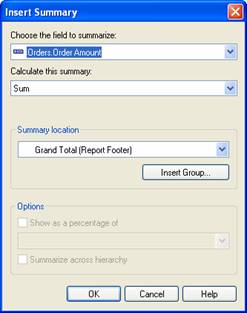
Figure 4-10. The Insert Summary dialog box.
By default, sub-totals are automatically placed in the group footer. You can move this field to the group header if you want to keep all the summary information in the same section and printed before the detail rows.
To change the summary function after it has been created, right-click on the summary field and select Edit Summary. This brings up a dialog box with a dropdown box of all the available summary functions. Select the one you want to change it to and click on the OK button.
Note
If you move a summary field into a new group, it takes the new group as its parent and calculates the summary value for that group.
If you were paying a lot of attention, you might have noticed that none of the summary functions in Table 3-1 calculate the percentage of a number. For example, if you want to show the percent sales that a sales person had in relation to the entire department, there is no way to do it. Of course, you could always do this calculation yourself using a custom formula, but you might think that with all the advanced functionality that Crystal Reports gives you that it would be a standard function. Well, it turns out that it is. The last option that the Insert Summary dialog box gives you is showing the summary as a percentage of another total.
Percentages are always calculated based on a total from an outside group. In other words, the percentage is calculated using an interior group value compared to a value outside of that group. For example, if you want to calculate the percentage of a value in a group, then this percentage will be based on the grand total amount because the grand total is outside of the group level. If you want to calculate the percentage of a value in sub-group, then it will either be based on the parent group or the grand total. You can’t calculate the percentage of a grand total value because it is already at the outer-most level and there is no outer number to calculate the percentage from.
Tutorial 3-4. Creating Summary Fields
This tutorial walks you through the process of creating summary fields that are displayed in the Group Footer. You will build a sales report that lists number of purchases they had, their total sales and their average sales.
1. Go to the Start Page and click on Standard Report Wizard.
2. When asked for the data source, choose the Xtreme.mdb database like you did in the previous tutorials.
3. Select the Customer table and Orders table and click the Next button. When the Link dialog box appears it shows that the two tables are related by the Customer Id. This is what you want so click the Next button.
4. From the Customer table, choose the fields Customer Id and Customer Name. From the Orders table choose the field Order Amount. Click the Next button.
5. For the grouping field, choose the Customer Id field and click the Next button.
6. The Summaries dialog box appears and you see that it has already pre-selected two summary fields: Customer Id and Order Amount. It makes sense to summarize the Order Amount, but not the Customer Id. Unfortunately, Crystal Reports obviously has no idea what the meaning of each field is so it automatically creates a summary field for every numeric field being printed. You have to remove the fields you don’t want. Click on the Customer Id summary and click on the left arrow button to remove it from the list.
7. Click the Finish button and the report is generated automatically. Your report should look similar to the one in Figure 3-o.
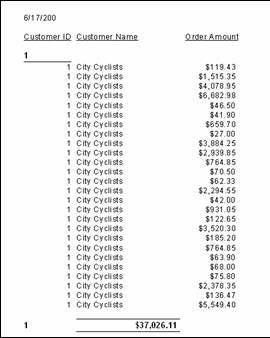
Figure 3-o. Customer Sales report first draft.
This is a decent first attempt at a report, but it needs some obvious corrections before we go any further. The first problem is that the sub-total for the Order Amount doesn’t line up with the Order Amount column. The second problem is that the Company Number and Company Name are repeated on each detail line when it really only needs to be shown in the group header. Let’s make those corrections now.
8. Click on the Design tab so that you can modify the report.
9. Look in the Group Footer and find the summary field for Order Amount. Move it to the right so that it is aligned with the Order Amount column (this would be a good time to practice using the Align feature). Also make the field width smaller because it doesn’t need to be that big.
10. Delete the Customer Number field from the Details section so it doesn’t get repeated.
11. Move the Customer Name field by clicking on it and dragging it from the Details section and up to the Group Header section.
12. Since the Customer Name field is now in the Group Header, it needs to match the formatting of the Customer Number. Right-click on the Customer Number field and select Format Painter menu item. Move the cursor onto the Customer Name field and the cursor will become a paint brush. Click on the field and it gets the same formatting as the Customer Number field. Now they both match.
13. Preview the report and it should look much nicer.
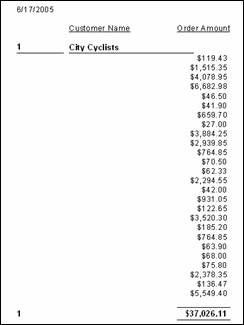
Figure 3-p. Customer Sales report with formatting changes.
Now we’ll add the summary fields to show how many purchases each customer made and their average sales amount.
14. Click on the Design tab so you can make changes to the report.
15. On the menu, select Insert | Summary (or click the Insert Summary button). The Insert Summary dialog box appears so you can choose the field to summarize.
16. Select the field Order Amount. For the type of summary, choose Average. For the summary location, choose Group #1. This creates a summary field that calculates the average order amount for all the orders placed by each customer.
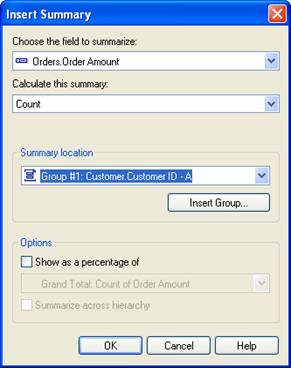
Figure 3-q. Insert Summary dialog box for Customer Sales report.
17. The summary field is automatically added to the Group Footer section. Move it next to the existing Order Amount summary field.
18. Add another summary field by selecting the menu items Insert | Summary.
19. Select the field Order Amount. For the type of summary, choose Count. For the summary location, choose Group #1. This creates a summary field that counts how many times the Order Amount field appears in the group. Consequently showing you how many purchases were made.
20. The summary field is automatically added to the Group Footer section. Move it next to the existing previous summary field.
21. The report is now finished and it includes three summary fields: the total sales (created by the report wizard), the number of sales and the average sales (both created by you). It is shown in Figure 3-r.
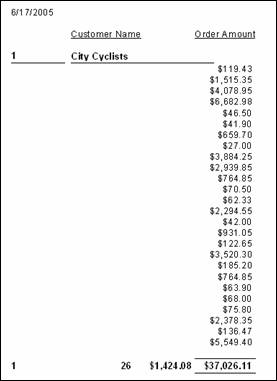
Figure 3-r. Customers Sales report final version.
Of course, if you were preparing this report for your company, you would want to spruce it up by creating column headers for the new summary fields and changing the formatting to make it fit the corporate image.
Running Totals
Running totals are like an advanced version of summary fields. They give you more ways of summing data and give you more flexibility for determining which data to summarize. The primary difference is that summary fields are calculated by group and running totals are calculated on a record by record basis.
Running totals are built-in fields that accumulate the total of another field. Since it is so common to summarize numerical data, Crystal Reports has this functionality built-in. Otherwise you would have to create formulas for summing these values and zeroing them out when appropriate.
A running total takes a field on a report, performs a calculation on it, and adds the result to a report-wide variable that keeps track of the total amount so far. There are various calculations that can be used with running totals so that they can be customized to your exact needs. You can also set the interval for when to perform the calculation. For example, you can do it on every field or whenever the field changes values.
Calling the field a running total is deceiving because the calculation doesn’t have to calculate a running total. There are over a dozen different calculations available. It could calculate the average of all the numbers printed so far, or it can print the largest of all the numbers. The simplest calculation, and the default, is the Sum operation. It sums a value as it is printed. Don't think that just because the field is called Running Total, that you are limited calculations that sums numbers.
To add a running total field to your report, right click on the numeric field that you want to track and select Insert | Running Total. This presents you with the dialog box in Figure 3-rr.

Figure 3-rr. The Create Running Total dialog box.
It should be immediately obvious that this dialog box is much more advanced than the simplistic Insert Summary dialog box you worked with in the last section. A few things that stand out are that in the middle of the dialog box is an evaluate area which sets when the running total should be calculated (for each record, on change of group, etc.) and at the bottom is a reset area that determines when the running total gets set back to zero.
When this dialog box opens, a default name is already filled in for you. You should immediately change the name to something descriptive. The dialog box has three areas where you can set the field’s properties. They are the Summary area, Evaluate area, and Reset area. They control how and when the running total is calculated. Each area is described next
The Summary Area
The Summary area is similar to the Insert Summary dialog box discussed in the last section because it sets the type of summary calculation (Sum, Average, Count, etc.) and the field to summarize.
The Evaluate Area
The Evaluate area determines when the field’s value gets added to the running total calculation. You can have a value get recalculated every time a detail record is printed, or if it is based on a group level field, then you can calculate it for every new group. You could also calculate it only when the summary field changes value. There are four options for when to evaluate the field and they each have a different purpose. They are described next.
For Each Record
Evaluating the running total field as each record is printed is the most common way of using running total fields. As each row is printed, the selected field’s value is used to update the running total field. You can use this option when you want to show the current running total in the Details section beside the field’s current value. Even if you don’t show the running total field in the Details section, you should use this option when every row in the report is going to be included in the running total.
On Change Of Field
This option only includes the field’s value in the calculation when the field’s value changes from one record to the next. If the current record has the same value as the previous record, then it won’t be counted. Evaluating the running total when a field changes is useful when there is repeated data in a field and you only want to count each value once. This frequently happens when the data source links two tables in a parent-child relationship. When this is the case, the fields from the parent table are repeated each time as the fields from the child table are listed. If you are summarizing a value from the parent table then the totals will be wrong because they will be incremented each time a child record is printed. To correct this problem, select the On Change of Field option and select a field from the parent table. This insures that the running total is only evaluated once for each record in the parent table.
When using this option, the way to select the field isn’t completely intuitive. There is a text box to the right of the option, but it won’t let you type anything into it. Instead you have to select the field from the field list on the left and click on the arrow button beside the option. Once you click on the arrow button the field name is entered into the text box. If you want to change the field you have to use the arrow button again. Although you can click on the text box and move the cursor around with the arrow keys, changes are not allowed.
When selecting the field from the parent table, it’s best to choose the primary key from the parent table. If you aren’t careful, you might think that you can choose any field in the parent table to determine when to evaluate the running total. But this isn’t always true because some records in the parent table will have the same value in a field over consecutive records. For example, if the parent table is the Employee table, you might select the Employee Name field. But it is very common for some employees to have the same name and selecting this field will result in the second employee’s data not being evaluated. Thus, in this example you should use the Employee Id field or the Social Security Number so that uniqueness is guaranteed.
On Change Of Group
This option is pretty self explanatory. The running total field is evaluated whenever the group changes. Thus, it is only calculated one time for each group in the report. This is similar to the On Change of Field option except that this option can only be used when the report has groups. When selecting this option, the dropdown box only shows you the available group names. If there are no groups then you can’t use this option.
Use a Formula
Evaluating the running total field based on a formula
lets you create more advanced running total calculations. There are times when
the other options are too simplistic to give you the running total result you
need. For example, you could have a running total which is only calculated when
a field is a certain value or a within a range of values. This can be used to
create multiple running totals and each one only summarizes data for a
particular country. One field could just summarize data when the country is
The Reset Area
Just as important as setting when to evaluate the running total is determining when to reset its value back to zero. If you are tracking the running total for individual groups, then you want it to reset every time the group changes. There are also times when you don’t want the value to get reset at all. If you want a running total to accumulate throughout the life of the report so that the last record shows the grand total, then you don't want to reset the value.
The Reset area gives you the option to never reset the running total, reset it when a field's value changes, reset it when the group changes or by using a formula. Clicking the formula button brings up the Formula Editor dialog box so that you can write more advanced formulas for determining when the running total is reset. Just like the Evaluate area, using the formula gives you the ability to reset the value using additional functionality not provided in the other options.
Placing the Running Total Field
Where you place the running total is very important. It is only as accurate as the most recent record printed. If you want to keep a running total of the detail records, then you would put the field in the Details section. If you put the field in the Group Footer section, then it will calculate the total as of the last record in the group.
You might recall from earlier in the chapter that when printing a subtotal on a group, you can put that field in either the group footer or group header and it still prints the same result. The location of a subtotal doesn't affect its value. This isn't the case with running totals because they are only accurate to the point that they get printed. If you put a running total in the group header, then it shows the calculation as of the first record in the group. Since the other records haven't been printed yet, they aren't calculated. An example report showing this behavior is shown in Figure 3-hg.
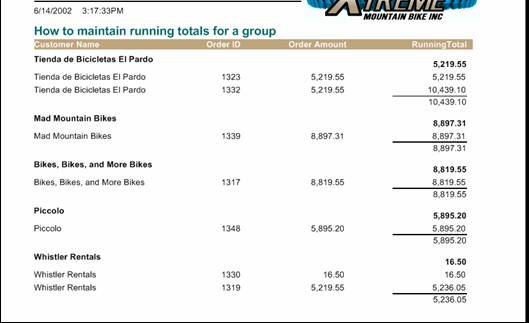
Figure 3-hg. The results of a running total field with a grouping report.
The report in figure 3-hg shows a running total column and there are three identical running totals fields. The running total field calculates the sum of each order amount, and it is reset when a group changes. There is a copy of it in the header, the detail, and the footer. You can see that the field in the detail section changes for every record and that the footer matches the value of the last record printed. But the header record doesn't match the footer value. Instead, it is equal to the first record printed in the group.
Running Totals Compared to Summary Fields
Running totals have similar functionality to summary fields, and they can also be duplicated with formula fields. This can cause some confusion as to when you should use a running total, a summary field, or a custom formula field. Each of these has its unique characteristics that you need to be familiar with to make the best choice.
Summary fields are an easy way to summarize data outside of the Details section. For example, you can put subtotals in the Group Footer and put a grand total in the Report Footer. But you wouldn't want to put either of these fields in the Details section.
Both Summary fields and Running Totals have a limitation that if the report suppresses data, then the summary calculation will include the records that don't get printed. It will show an incorrect value. This is because the summary field and running total is calculated without any knowledge of the conditional formatting formula within the Suppress property. They can't take into account which fields don't get printed.
To get around this limitation, you can create a running total field that evaluates based on a formula and this formula uses the same logic as the conditional formatting formula for the Suppress property. For example, assume the report only wants to show records where the Region field is equal to “West”. The Suppress property would have the following conditional formula:
Formula = {Customer.Region} <> “West”
Any records where the Region isn’t “West” are suppressed. To make the running total field calculate properly you have to modify it so that it only gets evaluated for the records that do get displayed. In the Evaluate area you would set the option Use a Formula and enter the following formula:
Formula = {Customer.Region} = “West”
Thus, if the Region is “West” then the value is included in the running total field. As an example of this, the report in Figure 3-ij is the same report as the last example. It suppresses some of the records from printing. The grand total field in the left column is a summary field that was added by right-clicking on the Order Amount field and selecting Insert Grand Total. The grand total in the right-most column is a running total field that sums the order amount. The running total field is evaluated using a formula that matches the suppress formula. It is only evaluated for records that get printed.
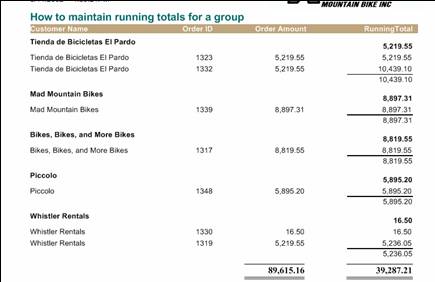
Figure 3-ij. Summary field incorrectly calculates the grand total.
You can see that the grand total that is calculated with the summary field is much larger than the running total that uses a formula. The summary field is including records that weren't printed on the report.
Using Formulas instead of Running Totals
Running totals have two limitations. The first is that you are limited in the types of calculations you can do (Sum, Avg, etc.). The second limitation is that running totals can’t be used with formulas that require the WhilePrintingRecords keyword. This is a formula that performs a calculation without using any database fields. If you want to calculate the running total of this type of formula then you have to do so using another formula. Let’s look in more detail about using a formula in place of a running total.
A formula can perform the same functionality as a summary field and running total. The difference being that you have to do the work of writing the code and debugging it to make sure it works properly. Formulas give you the benefit of being in complete control and you can use advanced functionality not provided with the Edit Running Total dialog box. Since formulas require more work, they should only be used when there isn't any other alternative.
When using a formula to calculate a running total, you need to create up to three formulas to do the job. The first formula, the summary formula, replaces the functionality of the Summary area and the Evaluate area. It performs the running total calculation. It has to have a global variable that tracks the current value of the running total. If it doesn’t reference any database fields then it should also have use the WhilePrintingRecords keyword so that it gets calculated while the report runs.
Once you write the formula and save it, you have to put it on the report so that it gets calculated. If the formula isn’t used on the report then Crystal Reports ignores it. Where you put it on the report determines when it is evaluated. If you want it evaluated for every record, then put it in the Details section. If you want it evaluated once per group then put it in the Group Header section.
The second formula, the reset formula, resets the total back to zero. Just like the first formula, where you put it determines when it sets the running total back to zero. If you want it reset for every group then put it in the Group Footer. If you want it reset for every page then put it in the Page Footer. Since the reset formula always has the same value (zero), you don’t want the user to see this formula on the report. You should open the Format Editor dialog box and check the Suppress property.
For running totals that accumulate their value for every record in the report and don’t need to be reset, then the reset formula isn’t necessary.
After creating the summary formula and reset formula and placed them on the report, you have replaced the functionality of the running total field and you are finished. However, there are times when you will also need a third formula. Let’s look at when a third formula is necessary and what it does.
In most circumstances you will put the summary formula in the Details section so that the user sees the running total for every record on the report. But what if you want the running total to only be displayed in the group footer or page footer? In this case, you will still keep the summary field in the Details section, but you will suppress it so that the user doesn’t see it. By suppressing the field it still gets calculated but it won’t be shown to the user. Since the summary formula is suppressed, you need to create a third formula to display the running total value in another report section. This third formula’s purpose is simply to print the value on the report.
Tutorial 3-5. Using a Formula to Replace the Running Total
Using a formula to replace the running total field probably sounds like a lot of work. But you’ll see that it’s really quite simple once you do it one time. This tutorial uses a formula to print the line number on every row and for each page it gets reset back to zero. This is similar to the RowNumber function in Crystal Reports except that the RowNumber function is cumulative over the entire report and never gets reset back to zero.
1. Open the Crystal Reports sample report, Group By Intervals.rpt. Save it as RunningTotalFormula.rpt.
2. We want to put the line number in the left most column of the page, but there isn’t room because the Customer Name if left justified. So move the Customer Name field and its header one quarter inch to the right.
3. Let’s create the summary formula which tracks the line number. In the Field Explorer window, right-click on the Formula Fields category and select New. Name the formula LineNumber. Click the OK button to open the Formula Workshop.
4. Enter the following formula:
WhilePrintingRecords
Global LineNumber As Number
LineNumber = LineNumber + 1
Formula = LineNumber
This formula creates a global variable, LineNumber, and increments it by one each time it is called. Since this formula doesn’t use any database fields, it has to have the WhilePrintingRecords keyword to force it to be calculated while the report runs.
5. Click the Save and Close button to save the formula and return to the designer.
6. Drag the LineNumber formula onto the report in the Details section. Put it directly to the left of the Customer Name field and resize it so that it fits.
7. By default, the LineNumber field will display two decimal places. You need to format this field so that it displays as an integer. Right-click on the field and select Format Field. On the Number tab select the format “-1123”. Click the OK button to save the change.
8. Now we need to create the reset formula so that the line number gets reset back to zero for every page. Create another new formula and call it LineNumberReset.
9. In the Formula Workshop dialog box, enter the following formula:
WhilePrintingRecords
Global LineNumber As Number
LineNumber = 0
Formula = LineNumber
This formula resets the LineNumber variable back to zero. Click the OK button to save the formula and return to the designer.
10. Drag the LineNumberReset formula onto the Page Footer section. Since you don’t want the user to see a zero in the page footer, open the Format Editor and check the Suppress property.
11. Preview the report and you should see a line number on every row and the line number gets reset for every page printed. It should look similar to the following figure.
Advanced Tutorials
As you learned throughout this chapter, Crystal Reports gives you many options for grouping report data and customizing the output. As your reporting needs grow more complex, you’ll find that it may not immediately obvious how to use the grouping options to give you the flexibility to create truly dynamic reports.
It is very common to want to re-use the same report for different reporting requirements. Reports that only differ by a few items can be consolidated into the same report by turning certain objects on or off. You’ve already seen one example during this chapter. Hiding groups gives a report the ability to show summary data by default and optionally show the detail data for users that want to see it. Rather than creating a summary report and a detail report, you have both reports in one. The next step beyond hiding groups is customizing them so that reports show different groups to different users as well as changing the order that are displayed in. This requires using a combination of parameters and formulas to customize the grouping structure.
These advanced tutorials present you with challenges you’ll probably encounter at some point and walks you through the steps to overcome them.
Tutorial 3-6. Dynamic Grouping Fields
The first challenge you might encounter is with reports that hide groups. This can cause unexpected results because even though the groups aren’t visible, they still affect the report output. For example, let’s look at a sales report that groups by Country and then groups by Product Type. This report shows how many products were sold within each country.
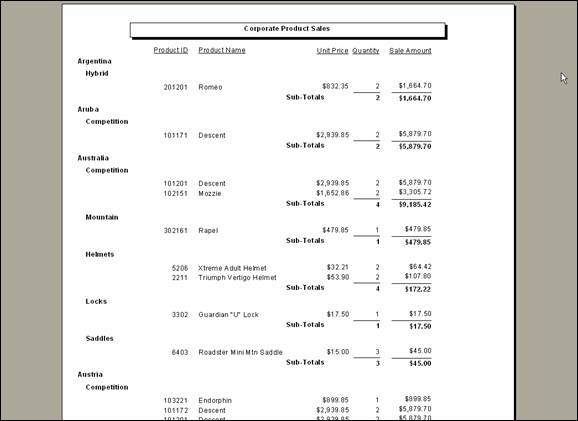
Figure 3-ta. Product Sales report grouped by Country and Product Type.
If you want to change this report to only show sales by Product Type, you can suppress the Country group. This is easy enough to do by right-clicking on the group name and selecting Suppress. But even so the report still looks very similar to the original report.
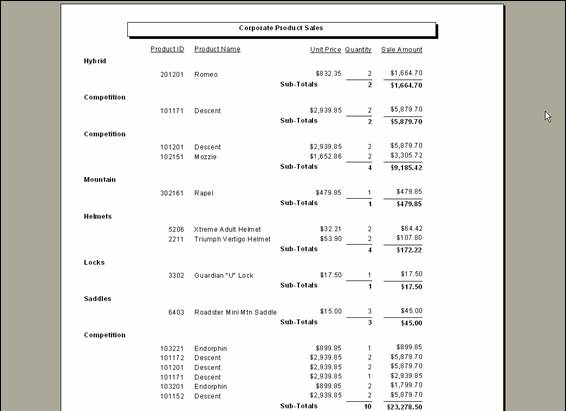
Figure 3-tb. Product Sales report with Country suppressed.
You can see that the Competition product type heading is duplicated because in the original report it was spread across multiple countries. It is still spread across multiple countries, but now the group headings aren’t visible. If this were truly a report that only grouped on Product Type then there would only be one Group Header for each Product Type. We need to fix this report so that it can be used to either show both groups or just the Product Type grouping and give the expected results.
The typical method of creating a group is to use a database field as the grouping field. But this locks you into a single group field and doesn’t give you any flexibility. An alternative which gives you more options is to create a formula that points to the database field and base the group on that formula field. Doing this lets you change the formula field and the group automatically changes as well.
Note
You can’t add new groups to a report while it is being printed. You can only hide existing groups. For example, if you have a report that needs to show anywhere between one to three groups, then you need to create the report using the maximum number of groups (three in this example) and then hide them when necessary. You can’t design the report using one group and then try to create two new groups using formulas.
This tutorial uses the report Sales By Country and Product Type.rpt. It is available via download at www.CrystalReportsBook.com or you can create it using the following report summary:
Report Summary: Sales By Country and Product Type.rpt
Tables: Customer, Orders, Order_Detail, Product, Product_Type.
Fields: Customer.Country, Product.Product Id, Product.Product Name, Product Type.Product Type Name, Order_Detail.Unit Price, Order_Detail.Quantity.
Group 1: Customer.Country
Group 2: Product_Type.Product Type Name
Formulas: {@SaleAmount}: {Orders_Detail.Quantity} *
{Orders_Detail.Unit Price}
Totals: Create a group summary for the fields Quantity and {@SaleAmount}. Create a grand total for Quantity.
Save the report as Sales By Country and Product Type.rpt.
To make this report so that it shows either both groups or only one group, there are three primary changes to make. The first change is basing the two groups on a formula rather than a hard-coded database field. The second change is creating a parameter that prompts the user for which type of report to print. The third change disables certain report objects (group header and footer, summary fields, etc.) so that only the appropriate ones are displayed when the report displays just one group.
1. Rename the file so that it doesn’t conflict with the original report (you’ll be using it for more tutorials). Select File | Save As and enter the name Sales – Multiple Groups.rpt.
2. Create a parameter to prompt the user for which type of report they want to print. Call the parameter Report Type. The prompt has two possible values: Country or Product. A screen shot of the parameters appears below.
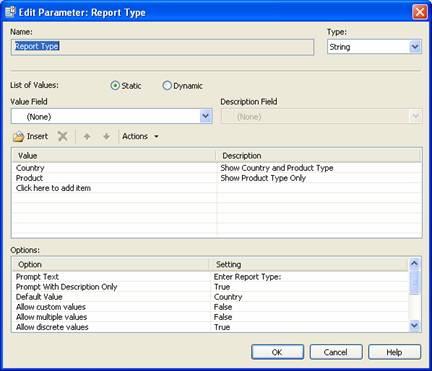
This report has two groups that are both based on a database field. Two new formulas are used to base the groups on. The first formula returns either the Country field or the Product Type Name field.
3. Create a new formula and name it MainGroup and type in the following code:
if {?Report Type}="Country"
then
{Customer.Country}
else
{Product_Type.Product Type Name}
This formula looks at the parameter value and if it is equal to “Country” then the formula return the Country field. If not, then we know that the report should only group on the Product Type Name field.
Caution
When using a formula to return the value to group on, each possible value must be the same data type. For example, you can’t have an If statement where the Then portion returns a String data type and the Else portion returns a Number data type.
4. Create a second formula and name it SubGroup. Type in the following code:
if {?Report Type}="Product" then
""
else
{Product_Type.Product Type Name}
Since this formula is for the sub-group, if the user only wants to group by Product Type then this group doesn’t need to return a value. Thus, it’s assigned an empty string as the grouping value.
5. Now that the formulas have been created, modify the groups to replace the current fields with the new formulas. Right-click on Group Header #1 and select Change Group. In the drop-down list select the Main Group formula. This set the group to be based on the formula instead of the Country field.
6. Change Group Header #2 also and have it use the SubGroup formula.
7. Preview the report (selecting the Country parameter value) to see what it looks like. It should look identical to the original report because you’ve only added the logic to duplicate the existing fields. No formatting changes have been made yet.
8. Preview the report again and select the Product Type parameter value. There are two problems immediately noticeable.
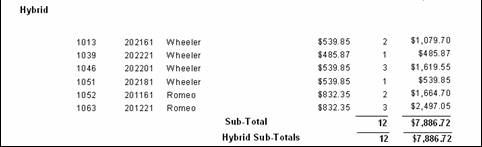
See how there is too much space between the group header and the first detail record? There are also two sub-total rows instead of one. Even though Group 2 doesn’t have any data, the header and footers are still being printed.[2]
The next step is to suppress these sections when only grouping on the Product Type field.
9. Let’s first disable the Group #2 Header when the report is only grouping on the Product Type. This is where we put the {?Report Type} parameter to use. Right-click on the Group #2 Header section and select Section Expert.
10.
On the Section Expert dialog box, look for the Suppress
property and click on the Formula Workshop button to the right. Enter the
following formula:
if
{?Report Type}="Product" then
True
else
False
This formula checks to see which type of report is being printed
by analyzing the {?Report Type} parameter. If the parameter value is
“Product” then this is the Product Type only report and the group header should
be suppressed. Thus, the value True is returned. Otherwise False
is returned and the group header is displayed.
11. Use the same formula for the Group 2 footer to suppress it when the report only shows the Product Type. Follow the same instructions for steps 9 and 10 but do it for the group footer.
12. Preview the report and select the Product Type only report. It should look much better now because the header doesn’t have extra white space below it and there is only one sub-total.
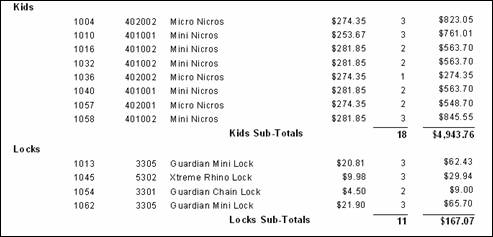
This tutorial showed that creating groups with dynamic fields can be done by creating a parameter to prompt the user for the report type and then using this parameter in formulas to dynamically change the formatting of the underlying report objects.
Tip
Using a formula as the grouping field gives you a wide variety of ways to customize groups. Formulas can do complex calculations that aren’t possible when referencing simple database fields. For example, you can parse text out of an existing field to group on a sub-string. Formulas can examine the values of other fields and create a new value based upon a calculation. For example, a shipping report could calculate the area of a package and group it as Small, Medium or Large. There are an unlimited number of ways to use formulas to create custom groups.
Tutorial 3-7. Custom Group Sorting
When creating a group, you have to specify the order to sort the data in (the default is ascending order). To make a report more flexible, you can let the user choose how to sort the report. For example, a person would want a report sorted in descending order by date if they want to see the most recent activity. But someone performing an audit would want to sort the date in ascending order so that they can see historical data first. Crystal Reports allows dynamic sorting by letting you specify a formula for the group sorting order.
Note
Dynamic sorting is only allowed on group fields. Crystal Reports doesn’t allow modifying the sort order of detail records. How unfortunate!
1. Open the report Sales by Country and Product Type.rpt that you created in the previous example.
2. Rename it to Sales with Custom Sorting.rpt.
3. Create a new parameter called Product Type Sort Order. This parameter prompts the user to sort the Product Type group in either ascending or descending order. The following screen shot shows how to set the parameter settings.
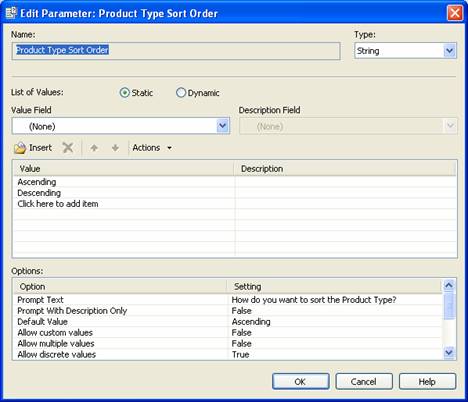
4. Now we want to modify the group sorting so that it uses a formula to determine the sorting order. Select Report | Group Expert to open the dialog box.
5. Select the Product Type field and click the Options button. This opens the Change Group Options dialog box.
6. Click the checkbox Use a Formula as Group Sort Order. This enables the Formula Workshop button.
7. Click on the Formula Workshop button and enter the following formula:
If {?Product Type Sort Order} = "Ascending" Then
crAscendingOrder
Else
crDescendingOrder
This formula checks the value of the parameter and sets the sort order accordingly. Notice how the sort order uses the constants crAscendingOrder or crDescendingOrder. These are predefined constants by Crystal Reports.
8. Preview the report and you’ll see that the Product Type sort order is based upon the parameter value.
This tutorial demonstrated that sorting data with groups has advanced techniques by integrating it with formulas and parameters. Certain problems that come with the basic grouping features are overcome with advanced programming.
Tutorial 3-8. Using the Grouping Functions
Report groups have the option of repeating the group header at the top of each page[3] and this is commonly used for printing column headers. While this is very helpful, there are times when this makes things tricky. For example, consider a report that has a group header which displays the group name at the top of the page and right below it the column headers are printed. The report has a requirement where the group name should be printed at the beginning of a page for a new group, but not at the top of each successive page. It has an additional requirement that the column headers have to be printed at the top of each page.
This requirement creates a problem because part of the header (the group name) should only be printed once per group and the other part (the column headers) should be printed at the top of each page. Both of them belong in a Group Header section, but they have different behaviors. The solution is to break the header into two sections and format each section differently. This requires using the functions specific to groups.
1. Open an existing report with a group header that has a similar requirement.
2. To make the group header repeat on each page, select Report | Group Expert. This opens the Group Expert dialog box.
3. Click on the group field in the list on the right and click the Options button. This opens the Change Group Options dialog box.
4. Select the Options tab.
5. Click the checkbox Repeat Group on Each Page. This forces the repeated header to appear at the top of each successive page.
6. Since you only want part of the header to appear at the top of each page, you need to add a second group header section. Right-click on the Group Header and on the pop-up menu select Insert Section Below.
7. Move the column headers into the new section. You can do this by selecting them and dragging them into the new section, or by cutting and pasting them there. At this point the group header looks the same, but the fields are split into two different sections.
8. Right-click on the group header and select Section Expert. This opens the Section Expert dialog box.
9. Click on the group header for Section A and click on the Formula Workshop button for the Suppress property.
10. Enter the following formula:
InRepeatedGroupHeader
The function InRepeatedGroupHeader returns True if the group header has already been printed on the report. It returns False the first time the group header is printed. On the group’s second page this function returns True and enables the Suppress property so that the group name doesn’t get printed. Since this formula isn’t used for Section B, the column headers are printed on every page.
11. Click the Ok buttons until all the dialog boxes close and you return to the report designer.
12. Save and preview the report. Notice that the group name only gets printed once per group and the column header gets printed at the top of each page.
13. You can also use the InRepeatedGroupHeader function to add a “Cont.” textbox to subsequent group headings. Set the Suppress property of the object to use the following formula:
Not InRepeateedGroupHeader
Since the Boolean Not operator prefixes the function, this causes the “Cont.” to be suppressed the first time the group header is printed and be displayed on the successive pages.
Tutorial 3-9. Formatting Hierarchical Groups
Creating hierarchical groups gives you the option to indent each child record a certain distance (creating a tree-view structure) or not indent them at all (each row is perfectly lined up with the one above it). Unfortunately, neither option is ideal. When indentation is turned on, you have to be make sure that the column headers are positioned in a way that makes the data legible even when it is shifting across the page. In addition to that, numbers that aren’t right-justified with each other are difficult to read. The option to turn off indentation isn’t very practical either because it forgoes using a tree-view structure that makes it easy to quickly understand the relationship between the parent and the child records. So which way should you use? Both!
Formulas can be used so that you can combine both features for professional looking hierarchical reports. What you want to do is indent the text fields and line up the numeric fields. The reason for indenting the text fields is that they are generally wider and can accommodate the extra space need for the text shifting from left to right. It also makes it possible to see the parent-child relationship between them. Indentation is turned off just for the numeric columns because people find it easier to read and compare values when the numbers are perfectly lined up with each other.
Crystal Reports lets you customize the indentation of each field by using a combination of the functions HierarchyLevel() and GroupLevel(). This lets you indent the text fields but not indent the numeric fields. Let’s see the steps to make this work.
1. Using a report with hierarchical grouping, open the Hierarchical Group Options dialog box by clicking Report | Hierarchical Grouping Options.
2. Set the Group Indent value to 0. This turns off indentation for all columns. The report now looks like a typical columnar report.
3. Right-click on a text field and select Object Size and Position. This dialog box lets you set the size of the object as well as its coordinates.
4. The X coordinate property contols setting the indentation level so that is the one we want to modify. Click on the Formula Workshop button associated with the X coordinate.
5. Enter the following formula:
(HierarchyLevel (GroupingLevel
({Employee.Employee ID})) - 1) * 1440 / 4
This formula calculates the hierarchy level by getting the current grouping level of the current record using the Employee Id field. It multiples it by 1440 (the number of twips per inch) and divides by 4 (to get a quarter of an inch). Each time a child record is displayed, it is offset by ¼ of an inch from the parent record above it.
6. Enter the same formula for all text fields that you want to indent.
7. When finished entering the formula for all text fields, preview the report and you should see that the text fields are being indented and the numeric fields are aligned with each other. This creates a report which makes it easy to see how the parent and child records are related and still have numeric columns that can be quickly compared and analyzed.
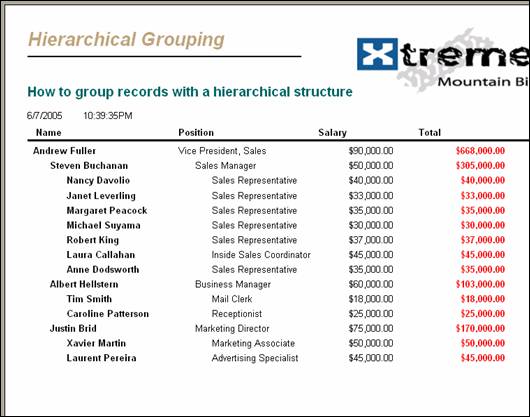
Tutorial 3-10. Breaking Reports Apart by Group
As discussed earlier in the chapter, the properties New Page Before and New Page After are used to cause page breaks between groups. This lets you break apart the report and distribute the individual pages. Unfortunately, setting these properties causes a blank page to be printed either at the beginning or the end of the report. For example, if you choose to enable the New Page Before property for the Group Header, then it always prints a new page before the first group record is printed. This causes a blank page to print as the first page. If instead you set the New Page After for the Group Footer section then you will get a blank page at the end of the report.
One way to get around this is to have an introductory page in the Report Header or a report summary page in the Report Footer. This insures that something relevant always prints before the first group or after the last group and you don’t have blank pages appearing. But sometimes adding these extraneous pages to the beginning or ending of a report isn’t acceptable. You need a way to disable these blank pages from being printed in the first place. This is done with a simple formula. The formula you use is dependent upon whether you want to use New Page Before or use New Page After. The one you choose doesn’t matter and it’s more of a personal preference. Just make sure you match up the property with the correct formula.
Option 1: Setting New Page Before for the Group Header
1. Open the Section Expert and select the Group Header.
2. Find the New Page Before property and click on the Formula Workshop button.
3. Enter the following formula.
Not OnFirstRecord
This disables the New Page Before property for the first record in the first group and prevents a blank page from printing.
Option 2: Setting New Page After for the Group Footer
1. Open the Section Expert and select the Group Footer.
2. Find the New Page After property and click on the Formula Workshop button.
3. Enter the following formula.
Not OnLastRecord
This disables the New Page After property for the last record in the last group and prevents a blank page from printing.