Chapter 2
Learning the Report Designer
Many people like to spend their weekends fiddling around their home doing small projects to keep their place fixed up. But before starting any new project you have to make sure you are familiar with the tools you are going to use on the project. For example, if you just got a new electric saw then you better read the instruction manual for how it works or who knows what will happen! You need to first spend a little time figuring out how to control the saw and understand how the pieces fit together.
The same applies to using Crystal Reports. Even though you are anxious to start dropping charts onto a report or creating Cross-Tabs, you first need to become familiar with the different parts of report and how the pieces work together. This chapter gives you a solid understanding of the fundamentals for using the report designer before you embark on the more adventurous aspects of creating reports.
You first see how to set the designer’s properties and how to setup the report’s basic structure. Secondly you learn how to add and manipulate report objects within the designer. By getting comfortable with how to use the different features of the Report Designer you will be ready to create more complex reports in the remaining chapters of the book.
Setting Designer Defaults
When working with reports there are certain aspects that you want to be the same for every report. For example, you might like to have report objects snap to the grid so that it’s easier to line up objects next to each other. Crystal Reports lets you set certain properties of the report designer so that they are the same all reports. The primary areas of the designer that you can control are the design area and the formatting properties of certain fields. To change these defaults select the menu items File | Options. It shows the Options dialog box in Figure 2-a.
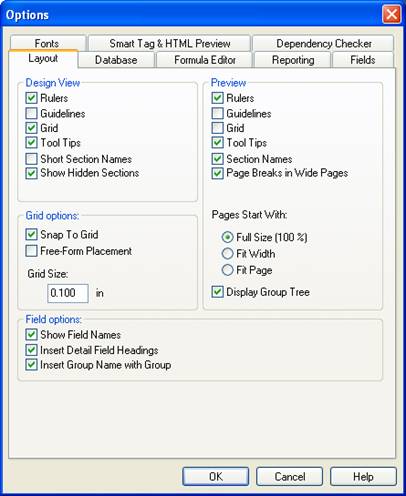
Figure 2-a. Report designer Options dialog box.
The Options dialog box might look a little overwhelming at first glance. There are eight different tabs to choose from and each tab has many options listed on it. To make it easier to understand, we are only going to look at the options that affect the Report Designer. We’ll look at the other options later in the book for the sections that they apply to. Table 2-b shows a description of each tab.
Table 2-b. Option dialog box tab descriptions.
|
Tab
Name |
Description |
|
Layout |
Sets the defaults for the report designer and the report preview. |
|
Database |
Changes which parts of the database can be chosen for reporting on and sets advanced optimization properties. This is discussed in Chapter 11. |
|
Formula Editor |
Sets the default programming language and code formatting properties. This is discussed in Chapter 5. |
|
Reporting |
Specifies how report data is treated. For example it determines how to handle Null values, whether to save report data with the report, etc. This is discussed in various areas throughout the book. |
|
Fields |
Set the default formatting of each type of data. You can have strings formatted differently than numbers. This is discussed in this chapter. |
|
Fonts |
Similar to the Fields tab, the Fonts tab sets the default formatting for different types of data. For example, you can specify a default format for summary fields that is different than the format of group name fields. |
|
Smart Tag & HTML Preview |
Sets up the properties used by Office XP smart tags and previewing reports in HTML format. This applies to Business Objects Enterprise and is not discussed in this book. |
|
Dependency Checker |
Determines which aspects of a report the dependency checker should analyze. Discussed in Chapter 5. |
Setting the Layout Options
The Layout tab (see Figure 2-a) specifies the default properties for both the report designer and the report preview. For example, it lets you set the how the designer looks, change the preview window, and display field information. It is organized into four categories: Design View, Grid Options, Field Options, and Preview.
Design View Options
The Design View options determine what is shown on the designer. Each option has a checkbox next to it that either turns it on or off. The first item shows or hides the rulers along the top and side of the designer. As a general rule, the rulers make it easy to position and size objects on the report. For reports that are used based on an existing form, the rulers make it possible to place the report objects so that they have exact placement on the existing form.
The second option turns gridlines on or off. Guidelines are dashed lines that extend from the edge of a report object to the ruler. They show exactly where a report object appears at all times. Although these lines don’t appear on the report, you can make them visible in the designer so that you can see which objects are associated with each guideline. Guidelines are discussed in more detail later in this chapter.
The third option turns the grid on or off. Seeing the grid makes it easier to position objects on the report. The fourth option displays tool tips as the mouse hovers over report objects. The tool tips give short descriptions of each object or tell you the database field being displayed. The fifth option determines whether the section names should be shortened. For example, rather than show “Report Header a” the section name would show “RHa”. The benefit is that if you get to use more of your design space for working on the report.
The last item in the Design View area toggles hidden sections. When this option is checked the hidden section appear as grayed out. They are only grayed out because it can be helpful to see how the section is designed. When the report is run they won’t be visible.
Grid Options
The purpose of the grid is to make it easy to keep report objects lined up with each other. By making report objects snap to the grid points you know that the objects will have a professional appearance. Of course, there are times when you need to make minute adjustments to the location of a report object and in this case the grid becomes a hindrance.
The first option, Snap To Grid, forces report objects to be placed on a grid point when they are added to the report or moved around a report. The second option, Free Form Placement is supposed to allow objects to placed anywhere in the section without snapping to the grid. However, it appears to have no effect and the only option that controls this aspect is the Snap To Grid option. The last item specifies the distance between grid points. You can make it smaller if you need more granularity over object placement but still want to use the grid so that objects line up with each other.
Preview Options
Previewing a report in the Preview tab has similarities to working in the report designer. Just like the report designer, it can display the rulers, tool tips, guidelines, etc. It also allows you to make changes to the report while you are previewing the report. This gives you the ability to immediately see how a change affects the final report output.
Since the Preview tab serves two purposes, previewing the report and modifying the report layout, you get to decide what modification tools to use. The preview options section on the Layout tab lets you show or hide the same things that the Design View section: rulers, guidelines, tool tips, etc. Each of these has a checkbox that lets you show or hide each one.
The unique options for the Preview tab are as follows. The option Page Breaks in Wide Pages indicates where the edge of a page is. You can also set the default zoom level to be Full Size, Fit Width, or Fit Page. The last option sets whether the group tree should be displayed. The group tree summarizes the group names in a tree format and lets you navigate to the group details.
Field Options
The primary purpose of a report is to display data from database fields. How these fields are displayed in the Design tab can be customized. By default, each field shows the field name. This makes it easy to see what data is going to be displayed to the user. But sometimes you want to get a feel for how the data will appear. When the option Show Field Names is unchecked, the Design tab replaces the field names with symbolic characters. For example, text fields are replaced with “XXXX” and numbers are replaced with “555,555”. See Figure 2-d for an example.
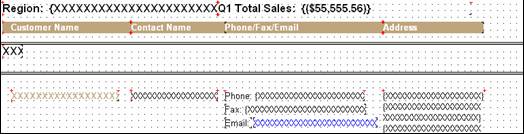
Figure 2-d. The Design tab showing symbolic characters.
When adding fields to a report, it is assumed that most fields have a header displayed above them so that the user knows what the data represents. A bunch of numbers on a page typically doesn’t make a lot of sense to the reader unless you identify what they are. To make it easier on you, when you add a field to the Detail section the header text is automatically inserted in the page header section. If you want to turn this feature off, uncheck the option Insert Detail Field Headings. A similar feature is available for groups. When you add a field to the group section, a header text field is added to the Group header section. To turn this feature off uncheck the option Insert Group Name with Group.
Note
Any changes you make within the Options dialog box apply to every report. To make changes specific to only the current report, do so within the Report Options dialog box which is described later.
Setting the Default Format Options
After adding fields to a report you frequently have to format each one to the proper font, alignment, format, etc. If a report has settings that are consistent across multiple reports, you can set the default properties that are applied to each field.
The Options dialog box has two tabs that set formatting properties. The first is the Fields tab shown in Figure 2-e.
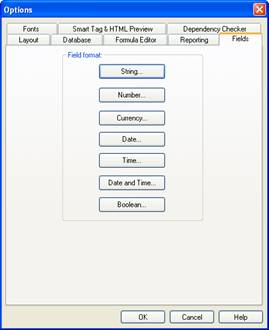
Figure 2-e. The Fields tab formats different field objects.
The Fields tab controls setting the default formatting based upon field type. For example, the formatting for a String object is different than the formatting of a Boolean field. By clicking on the button for each type of field, the Format Editor dialog box appears. This dialog box has more tabs for setting properties such as Can Grow, Alignment, CSS Class, Border styles, etc. Set the properties that you want to be the default and then click the OK button.
Not all formatting options apply to each type of field. For example, the String object doesn’t need to specify the default date format. Thus, the Date tab is only shown for the Date object. Setting the default properties for some objects is more useful than other objects. For example, the String object lets you set properties such as Suppress, Can Grow, Text Rotation, and the line styles of the border. Each of these properties is really only used in unique circumstances and therefore isn’t something that generally gets set as a default property. On the other hand, the way you format a Date object is usually the same throughout all your reports. For example, a company might have a policy that all dates show the month using three letters and the year is four digits. This isn’t going to change so it’s a good idea to set it as the default. The same applies to how numbers and Boolean values are displayed.
The second formatting tab within the Options dialog box is the Fonts tab. It lets you set the default font style depending upon what the field represents. You can set the font for Summary fields, Group Name fields, Field Titles, etc. For example, it’s very common for a Summary Fields to have different font properties than the Group Name Field. Setting the default font properties saves you time when designing reports.
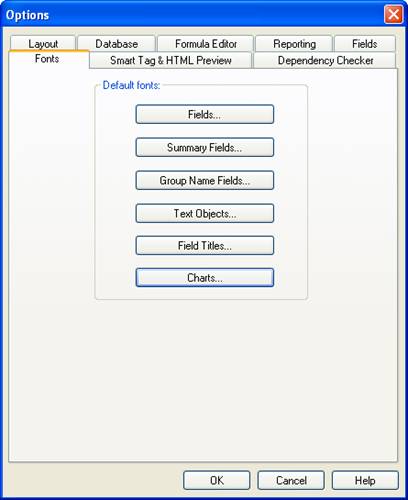
Figure 2-e. The Fonts tab formats different field objects.
Note
The Default formatting is only applied to an object when it is dropped onto the report. If you later change the default formatting, these changes are not applied to objects already on the report. To apply the default settings to an existing object you have to delete the object and then add it back to the report.
Setting Report Options
After setting the options for customizing the report design experience, the next step is to customize the setting for an individual report. There are different options that effect a report’s behavior and how it’s printed. These change based upon how the report is to be used.
Page and Printer Options
The first aspect of a report that needs to be decided is the page size and orientation. These properties are set with the Page Setup dialog box. Click on the menu options File | Page Setup.

Figure 2-f. Page Setup properties.
The Page Setup dialog setup is pretty self-explanatory. In fact, it’s similar to the Printer Page dialog box you see in most Windows applications. The first two options set the paper size (Letter, A4, etc.) and the printer’s paper bin. The options after that set the paper orientation (portrait, landscape) and the margins.
The last option is the most interesting of them all: No Printer. Even though you assume most reports will be sent to a printer, there are times when it’s beneficial to not specify a default printer. Let’s look at how this works.
We first need to talk about printer drivers. Although you might assume that each report will look the same no matter which printer it is printed on, this isn’t the case. Each printer has a software driver associated with it that determines how something gets printed. There are very small differences between each type of printer that can vary the output just slightly. Although this probably seems insignificant right now, when you are creating reports that require each object to be in a precise location on the paper (e.g. forms based reports), then even a small variation can have a big impact. Another time this is important is when a report tries to print so much data on a single page that you try to squeeze everything down to fit. You shrink the report so that when it prints on your printer everything is sized perfectly. But then you distribute the report to the rest of the company and people start complaining that the digits of some numbers are getting chopped off. When you investigate the problem you find that they have a different type of printer than you do and their printer sizes the fonts slightly different than your printer. This wastes all time you spent perfectly sizing everything. In some circumstances you will find that the person has the same printer as you do, but they haven’t downloaded the latest printer drivers like you did and this messes things up as well. So you can see how print drivers can have a big impact on a report’s output.
When you check the No Printer option, the report is optimized to be displayed on the screen. When the No Printer option isn’t checked, the report uses your computer’s default printer driver to display the report preview. This gives a more accurate representation of how it will look when printed on that specific printer. If you want to specify a printer other than the computer’s default printer, click the Printer button and select the printer from that list. If you want to use a type of printer that your users have but you don’t have access to, then you need to at least install the printer driver so that Crystal Reports can use it for the report preview.
Of course, if your reports don’t require precise placement of report objects then worrying about the No Printer option isn’t necessary because the default settings will usually be fine.
Tip
If your users all have different types of printers then it is
sometimes best to choose the No Printer option. By telling
Summary Info
Each report has summary information associated with it. This makes it easy to determine who designed the report and what its purpose is. The Document Properties dialog box is where you enter this information. Open it by selecting the menu options File | Summary Info.
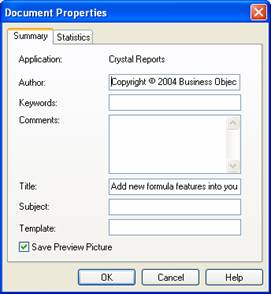
Figure 2-g. The Document Properties dialog box sets the summary info.
One interesting benefit of saving Summary Info is that its information is displayed in the Open File dialog box. The fields you can enter information for are: Author, Keywords, Comments, Title and Subject. This makes it easy to find out about a report and see a preview of it before opening it. Considering that report file names sometimes use cryptic abbreviations, this makes it easier to determine which report to open. Enabling this feature of when opening files is discussed later in the chapter.
Crystal Reports gives you a few different fields for setting report These make it easier for someone else to look at the report and quickly see what the report does as well as find out who to contact if there are any questions.
The Save Preview Picture checkbox set whether to save a snapshot of the first page of the report with the report file. If a preview picture is saved, then you will see a snapshot of the report when opening a file.
Miscellaneous Report Options
The last location for setting report options is the Report Options dialog box. It lets you set a variety of different options such as database optimization settings, using report alerts, the handling of grouping data, etc. I hesitate to mention this dialog box at this point in the book because all these options are advanced settings and aren’t appropriate for an introductory chapter. All these topics are discussed within the appropriate chapters later in the book. However, just so that you see what I’m talking about, you can get to the Report Options dialog box by selecting the menu options File | Report Options. It is shown in Figure 2-h.
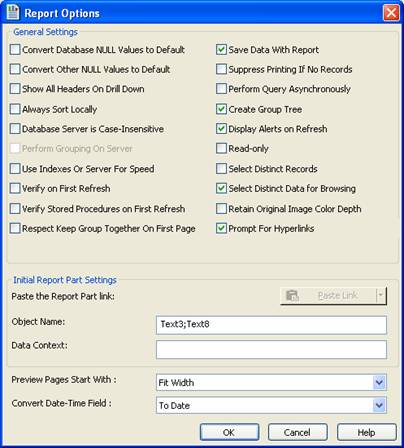
Figure 2-h. The Report Options dialog box.
Designing Reports
The best way to become familiar with how to design reports is to start with the basics. Once you understand how the designer and the individual report objects work, then you’ll be ready to move on to advanced topics of report design (and finally start doing something fun!)
The default view of the Report Designer is divided into five sections: Report Header, Page Header, Details, Report Footer, and Page Footer. Each section determines where its related data appears on the report. Table 2-I gives you a summary of each section.
Table 2-i. The five default report sections.
|
Section
Name |
Description |
|
Report Header |
Appears at the beginning of the first page of the report. It only appears once on a report. |
|
Page Header |
Appears at the top of the page. It is repeated on each page. For the first page of a report it appears after the Report Header. |
|
Details |
Usually appears on every page of the report and it makes up the bulk of the report. A Detail row is printed for every record selected from the database. |
|
Page Footer |
Appears at the bottom of the page. It is repeated on each page. For the last page of a report it appears before the Report Footer. |
|
Report Footer |
Appears at the end of the last page of the report. It only appears once on a report. |
If you think of a report as a book, the Report Header is like the Title Page or the Introduction chapter. It appears at the very beginning of the report and can be used to display a corporate logo, the report title, the date and time the report was printed, or even an introductory paragraph explaining the purpose of the report. The Report Header is also useful for displaying summary information to the user. For example, by showing some carefully thought out charts the user can get an immediate idea of the data that is shown within the report.
Continuing with the book analogy, the Page Header typically shows non-data information on each page. Some examples are the page number and field headers. For reports that have many columns of data, it’s important to display the field titles in the Page Header so that the user doesn’t have to flip back to the first page to see what each number represents.
The Details section of the report is where the true content of the report appears. This is the primary section for displaying the database fields and it gets repeated for each record.
The Page Footer can display information such as page number, and the print date.
The Report Footer displays summary information for all the data in the report. This includes a grand total for the numeric columns as well as displaying summary calculations such as the total number of records printed
Although I listed general suggestions for what is shown in each section, this is not a hard and fast rule. For example, I said that the Page Header usually shows non-data information. But that doesn’t mean that you can’t put database fields and formulas in the Page Header. A report that prints Invoices will use the Page Header to show the customer’s name and address as well as the PO Number. The Page Footer shows the invoice total, any applicable discounts, and the payment terms. Proper use of graphics in each section helps highlight different parts of a report and gives it a touch of class. Remember that the key to designing professional reports is to be creative with object placement, but not get carried away.[1]
Adding Report Objects
The majority of your time spent designing reports is spent working with the report objects. Crystal Reports gives you many types of objects for designing reports. Learning how each works is critical to being a proficient report writer. This section covers most of the available report objects (the more complex ones have their own chapter). There are two classifications of objects that can be added to a report: Report Objects and Field Objects. Report Objects are added by clicking on the Insert menu Item or using the Insert Toolbar. Field Objects are shown in the Field Explorer Window and they can be dragged and dropped onto the report. For this chapter we’ll keep it simple and focus on Report Objects. The different Field Objects are covered in separate chapters because they are much more complex than the typical Report Objects. For example, Database Fields are covered in Chapter X, Database Connectivity, and Formula Fields are discussed in Chapters X and Y.
Report objects are the building blocks of a report. They let you display data from a database, draw graphics and show charts for more complex printing. By understanding the purpose of each report object and how to best use it, you can create reports that display complex information in an easy to read format. In this chapter we focus on the basic report objects and save the more complex objects for later chapters.
There are two ways to insert objects onto a report. The first is using the Insert toolbar shown in Figure 2-q. The toolbar has an icon for each type of object that can be dropped onto the report. Click on the object to insert and, depending upon the type of object it is, the mouse changes so that you can place it on the report.
![]()
Figure 2-q. The Insert toolbar
The second method of adding an object to a report is using the Insert menu option. Click on the Insert menu item at the top of the program and it presents a list of all the objects that can be added. It works the same as the toolbar: click on the object to insert and move the mouse to where the object should be placed.
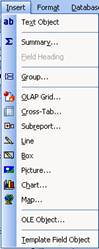
Figure 2-17. The Insert menu option.
A third method is to right-click on a report and the pop-up menu has a few insert options. However, this menu only lets you insert text objects, a cross-tab or a chart. Its uses are limited.
The objects that can’t be added to a report via the toolbar or menu are the objects in the Field Explorer window. These include the database fields, formula fields, parameter fields, etc. Inserting these objects onto your report requires dragging and dropping them from the Field Explorer window onto the report.
There are a lot of different objects that can be used on a report and there are many ways to use them. Most people learn best by example, so let’s create a report that uses all the objects and shows the different ways they can be used. What we’re going to do is create a report “sandbox”. I call it a sandbox is because we’re just going to play around with the different objects and see what happens. It’s like being a kid where you just want to throw all your toys in it and get messy. We’re not going to worry about making things look pretty right now. We just want to see how everything works.[2]
The first thing to do is create the “sandbox” that we’ll be working in. Create a blank report that uses the Employee table. For right now we won’t even add any fields to the report. We just want them to be available when we need them.
1. Go to the Start Page and click on the Blank Report option under the New Reports heading. This opens the Database Expert dialog box.
2. In the Database Expert dialog box, open the Create New Connection node and select the Access/Excel (DAO) option. This opens the Access/Excel (DAO) dialog box.
3. Click on the button next to the Database Name textbox and navigate to the Xtreme.mdb database. The default installation folder is C:\Program Files\Business Objects\Crystal Reports 11\Samples\en\Databases\Xtreme.mdb.
4. Click the Finish button to save the database connection.
5. Open the Tables node and double-click the Employee table. This adds the Employee table to the Selected Tables list on the right.
6. Click the Ok button to accept the changes.
7. Click the menu options File | Save As and enter the filename Sandbox.rpt. Click the Save button.
You now have a blank report that uses the Employee table as its data source. If you look in the Field Explorer window and click on the Database Fields node, you should see the Employee table listed. Let’s play!
The Text Object
The text object is used to display text, database fields, and special report fields. Each text object can display one of these or a combination of all three. After adding a text object to the report you have to enter the text to display. If you want to go back and edit the text, double-click on it.
Tutorial 2-1. Formatting Text Objects
This tutorial demonstrates various formatting properties of the text object. Over the next few pages you’ll add text objects to the Sandbox.rpt report and see how different formatting options effect the output.
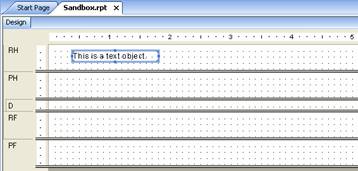
1. Add a text object to the report by right-clicking anywhere on the report and selecting Insert Text Object. You can also click on the menu option Insert | Text Object. This changes the mouse to a crosshair.
2. Move the mouse to where you want the top left corner of the text object to be. I’m going to place my text object in the Report Header section, but you can add it wherever you like.
3. Click on the mouse button and hold it down to expand the text object to the size you want it. Let go of the mouse to finish. The places the cursor in the text object so you can type something.
4. Type whatever you like in the text object. In my report I entered “This is a text object.” Remember, we are just playing around here so don’t stress out over you put in the text object. Hopefully you are more creative than I am!
Using Fonts and Borders
This text object isn’t very exciting, so let’s spruce it up a bit! The most obvious thing you can do with text is to change the font. Right-click on the text object and select Format Text. This opens the Format Editor. There are five formatting tabs here, but we’ll just look at the Font tab for now. The other tabs are discussed soon.
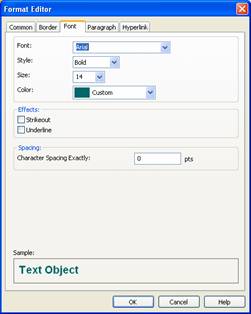
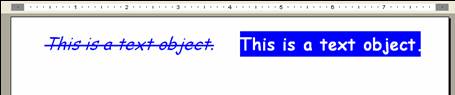
The Font tab is pretty simple to understand. The top section lets you change the font, the style (regular, bold, italic), the font size and the color. The other sections let you set effects like strikeout and underline. You can also set the spacing between each character. I’m going to make my text a little more interesting by setting the font to Comic Sans MS, setting the size to 30 and enabling strikeout. At the bottom of this dialog box is a sample showing the effect your changes will make. Click the OK button when are finished and you want to see it on the report.
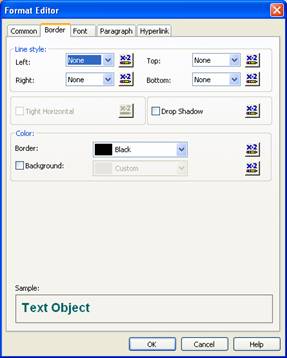
The Border tab of the Format Editor lets you add a border to each of the four sides of the text object, change the type of border (single, double, dashed, dotted), and set the color. It also lets you add effects like a drop shadow or a background color.
Let’s create a new text object and format it to be inverse.
1. Create another text object using the steps shown earlier and open the Format Editor dialog box.
2. Set it to be inverse by opening the Format Editor and going to the Border tab. Check the Background option and change the background color to Blue. Since the background is blue, it will be difficult to read the text.
3. Go to the Font tab and set the color of the text to White. Also set the style to Bold so that it stands out more. Click the OK button to save your changes. If you click on the Preview button your report should be similar to the one below.
Note
Financial reports use border formatting to give emphasis to certain types of numbers. The most common being sub-totals and grand totals. Sub-totals frequently display a single line below the number. Grand totals will have a single line above the number and a double-line below the number to make it stand out more.
Even though it’s easy to open the Format Editor dialog box to change the font and borders, it’s much easier to use the Formatting toolbar. Look at the top of the screen and it should be the second toolbar below the menu items (assuming you haven’t moved your toolbars around).
![]()
The first few items set the font and the font size. The next few buttons change the style. After that you can change the alignment, color, borders, etc. Just highlight the text you want to format and click on the button. Of course, not every formatting option is on this toolbar. But the most common ones are there.
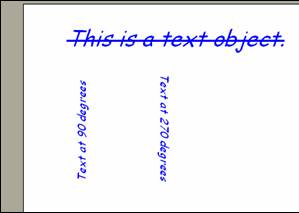
Rotating Text
Crystal Reports has another trick up its sleeve. It lets you rotate rotate text vertically. You can rotate it either 90 or 270 degrees. Go to the Format Editor again and on the Common tab you’ll see the Text Rotation property in the middle. It’s set to zero by default.
Formatting Paragraphs
The text objects we’ve created so far are only display one line of text. But some formatting options are designed to make it easy to display text in paragraph format. It’s easy to make a text object larger to display multiple lines. Just make the text object taller and select the Paragraph tab from the Format Editor dialog box.
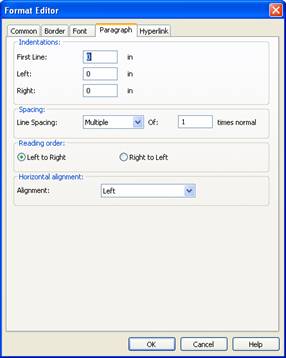
The top portion has the paragraph indentation properties for the first line and left and right margins. This lets you offset the first line from the rest. The other options control the line spacing and the alignment.
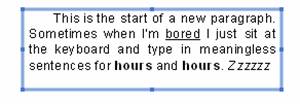
If you have to print a lot of text in one area, some parts of the text might need to be formatted differently than the rest. For example, you might want to underline certain words to signify importance. Rather than format a bunch of text objects and line them up side by side, Crystal Reports supports RTF (Rich Text Format) output. This means that a single text object can have multiple formats applied to different parts of the text. It’s very easy to do. Just type in all the text as normal, and then go back and highlight the text that needs special formatting and apply the new formatting. Let’s try another example.
Tutorial 2-2. Applying Multiple Formatting Properties
1. Add a new text object anywhere on the report and make it tall enough to show a few lines of text. But don’t make it too long.
2. Enter some text to fill up the text object. Notice how the cursor automatically moves to the next line when it gets to the edge of the box.
3. Right-click on the text object and select Format Text. Click on the Paragraph tab.
4. We want the first line to be indented and the margins to be offset from the border of the text object.
5. Enter 0.25 for the First Line property. Enter 0.05 for both the Left and Right properties. Click the Ok button. Notice how much nicer it looks.
6. Let’s change some of the formatting within the text. Double-click inside the text object to put it in edit mode. Highlight one of the words and make it bold. Highlight another word and make it underlined. Your paragraph might look similar to mine.
The benefit of learning how to format text objects is that the same formatting can be done to many of the objects on a report. For example, the next section discusses the field object and it can be formatted just like text objects.
Field Objects
The typical field object displays data from a table or a formula. Some other fields in the Field Explorer are formulas, parameters, and special fields. Special fields are discussed in the next section and the other types of fields in discussed in the appropriate chapters.
The previous tutorials demonstrated how to use different formatting within a single text object. Another interesting aspect of the text object is that you can embed fields objects within text objects. The benefit is that the spacing between fields is automatically adjusted and extra space is eliminated. Let’s look at an example of an employee’s address where the city, state and zip code are placed next to each other. The first figure shows the address fields adjacent to each other in the Details section. The second figure shows what they look like in Preview mode.
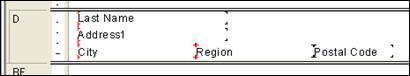
Figure 2-h. Addresses in the designer.
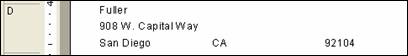
Figure 2-i. Addresses in preview mode.
Notice in the first figure that when the fields are placed next to each other in the Details section that each field has to be large enough to accommodate the maximum amount of characters. If the field is too small then part of the data will be cut off. As you can see in the second figure, this results in address fields that are too far apart.
The way to solve this problem is to embed the fields in a text object. Text objects are flexible because not only can you type text in them, but you can put fields into a text object as well. This squeezes all the fields together so that they are adjacent to each other and there isn’t extra space between them. You can also type regular text between the fields and they all fit accordingly. This is useful when writing form letters where there are large paragraphs of standard text and you want to insert a field into it (e.g. the person’s name or something they purchased from you).
When you drag the database field into the text object, the mouse changes to a blinking cursor to show you where the field will be inserted. Look at the next figure to see how a single text object uses all three address fields and inserts a comma after the city. The figure after that shows how much better it looks in Preview mode.
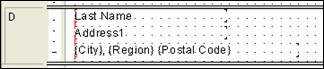
Figure 2-j. Embedded fields in the text object.
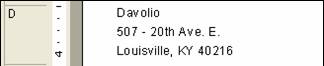
Figure 2-k. Embbeded fields in preview mode.
Embedding fields into text objects can also be done for formulas, parameters, and any special field.
Fields that Can Grow
When working with database fields it’s common to show fields that display a large amount of data. For example, an inventory table can have a Description field that stores a lot of data. Depending upon the inventory item, some descriptions will be short and other will be long. When you add the Description field to the report you want to make it tall enough to display multiple lines of information, but this will leave a lot of empty space for the short descriptions. The way to solve this problem is to make the field only one line tall and enable the Can Grow option. The Can Grow option lets the field expand to as many lines as necessary so that the full field is displayed. The Can Grow option is located on the Common tab of the Format Editor.
Note
Fields can only grow taller. They won’t grow wider.
The next two figures illustrate printing a person’s first and last name as well as some notes about the person. The first figure shows the fields in the Design window. Notice that the Notes field is only one line tall. Although you can’t see it here, the Can Grow option has been enabled for the Notes field. The second figure shows the preview of the report. Notice that the Notes field has grown so that all the data can be displayed.
![]()
Figure 2-l. A Can Grow text object in design mode.
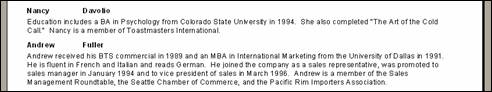
Figure 2-m. The text object displaying multiple lines of text.
Sometimes there can be so much data in a field that displaying it causes the report to look unusual and could even span over multiple pages. As a precaution to make sure the field doesn’t grow too large, there is a property to set the maximum number of lines. It is also on the Common tab of the Format Editor and located next to the Can Grow checkbox. By default the number of lines is set to zero which effectively disables the option and there is no limit. If you want to set a limit then override the zero with the maximum number of lines. The field height will not exceed the number specified.
One thing to be aware of is that if another field is located below a field that has the Can Grow option enabled, then it’s possible that the top field will expand over the field below it and overwrite it. There are two ways to prevent this. First is to make sure that no fields are close enough to the Can Grow field that they might be overwritten. This isn’t a very practical solution because it requires leaving a lot of blank space between the fields. The second option is to put the Can Grow field at the bottom of the section so as the field grows the section enlarges to compensate for the extra lines needed. The data in one section won’t overwrite the data in the next section. If it isn’t practical to put the Can Grow field at the bottom of the section, then insert another section below the current section and put the extra fields in the new section. This trick is discussed in Chapter 8.
One final feature of the text objext is that you can import an external text file into it. Double-click on the text object to go into edit mode. Then right-click on it and select Insert from File. This opens the File Open dialog box that lets you select the text file. The file’s content gets inserted into the text object.
Special Formatting
There are two types of data that have their own formatting
built-in: Rich Text Format (RTF) and HTML.
Formatting Strings
The tutorials earlier in the chapter showed you different ways to format a text object. But it didn’t discuss all the different formatting options available. The Format Editor has many more options for modifying the way string based report objects appear. The different formatting options are available for textbox objects as well as formulas, report fields, and special fields. Access the formatting dialog box by right-clicking on the field and selecting Format.
The first tab of the Format Editor dialog box is the Common tab (see Figure 2-18). The properties shown on this tab are common to most of the report objects available. These properties are described in Table 2-2.
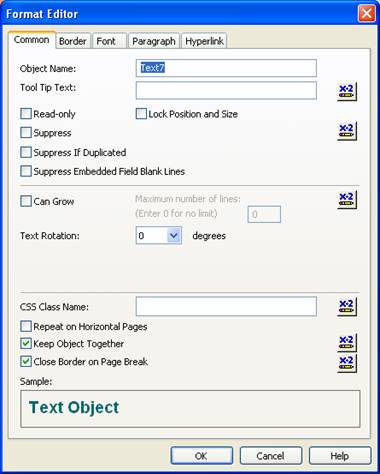
Figure 2-18. The Common tab.
Almost every option has a Formula Workshop button associated with it. This lets you apply custom formatting to the object using formulas. This is discussed in more detail in Chapter 5.
Table 2-2. Properties of the Common Tab
|
Property |
Description |
|
Tool Tip Text |
Use the formula editor to set a string that is displayed when the mouse hovers above the field. |
|
Read-only |
Prevent the object from having any additional formatting changes made to it. |
|
Lock Position and Size |
Prevent the object from being moved or resized. |
|
Suppress |
Hides the object. |
|
Suppress If Duplicated |
Hide the object if it had the same value in the prior record. |
|
Suppress Embedded Field Blank Lines |
Suppress fields with no data so that a blank line doesn’t appear. |
|
Can Grow |
Allow the field to expand if the object isn't big enough to hold the data. The field will only expand vertically and result in the height increasing. The width does not expand. |
|
Text Rotation |
Rotate the text to a specified angle. A value of 0 is the default and the text displays horizontally. A value of 90 rotates it vertically upward. A value of 270 rotates it vertically downward. |
|
CSS Class Name |
If you use a CSS file to format report objects, then enter the CSS class name that should be applied to the object.[3] |
|
Repeat on Horizontal Pages |
Repeats an object when a cross-tab expands horizontally across multiple pages. |
|
Keep Object Together |
Do not let the object cross over into another page. |
|
Close Border on Page Break |
If a field has a border, and the field extends to another page, then this will close the border on the first page. |
The next two tabs on the Format dialog box are the Border tab and the Font tab. Both of these tabs are simplistic and don't have anything unusual in them. The Border tab lets you specify which sides should have a border and it also lets you can change the shading around the object. The Font tab has properties to change the font and use different effects such as strikethrough and underline.
Formatting Numbers
Numbers are very similar to regular text objects in that they display characters on the report. The difference being that they can only display numeric characters. Thus, while they have similar formatting features (fonts, borders, etc.), they also have unique formatting features (currency, number of significant digits, etc.).
The Line Object
The line object does exactly what you expect. It draws a line. There isn't a whole lot you can do with this except change its color, the width and its style (single line, dashed line, etc.) It does have one interesting feature that solves a common problem with line objects. The problem occurs when you draw a vertical line on a detail section. There are times when the detail section has a field that can grow down the report and make the section longer than expected. Since the line has a certain length, when the text object grows the line stays the same size. If you want the line to be unbroken throughout each row then you will be disappointed. To fix this, set the property ExtendToBottomOfSection to True. This insures that no matter how short your line is, the end point will be the bottom of the section. If it is a horizontal line, this always moves it to the bottom of the section.
Note
The line object can only do horizontal and vertical lines. It can’t display lines at an angle.
The Box Object
Like the Line object, the Box object isn't too exciting. You can change its color, width and style. One nice feature about it is that you can change its properties to round the edges. Depending on how you set the properties, you can make it elliptical or even turn it into a circle. The properties that affect this are CornerEllipseHeight and CornerEllipseWidth. Rather than modify these directly using the Properties window at the bottom right hand corner of the screen, it is much easier to use the Format dialog box. The second tab is the Rounding tab. It has a picture of what the box looks like and below it is a slider. As you move the slider from the left to the right, it increases the curvature of the edges. When the slider is at the far right, the box is a circle. Once you click OK, the dialog box automatically sets the corner ellipse properties for you.
The Picture Object
The picture object is used for displaying the following image file formats: BMP, JPG, TIFF, and PNG. It doesn’t display GIF files. The formatting options are similar to the other controls in that it has the tabs Common and Border with similar functionality. The Picture tab, shown in Figure 2-x, that lets you resize, scale and crop the image.
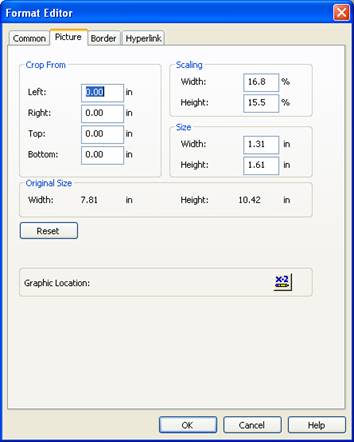
Figure 2-x. The Picture tab of the Picture object's dialog box.
If at any point you feel that you resized or scaled it improperly and you want to restore it back to its original size, click the Reset button. The only disappointment is that there is no option to preserve the picture’s scale. For example, I will often shrink a picture down to a certain width that fits in the allocated space. I would like the height to automatically shrink down so that the picture keeps the same proportions. But instead I also have to manually adjust the height and I have to visually guess to try and make sure the final picture looks right. Sometimes I’ll use the Windows Calculator application to have it do the calculations for me.
Printing Wingding Fonts
Don’t think that printing graphics involves just display JPG and BMP files. You can also get some interesting results using the non-standard fonts. One font in particular that is very useful is the Wingdings font. For example, open the Windows Character Map application and select the Wingdings font from the dropdown box you’ll see the characters in Figure 2-m.
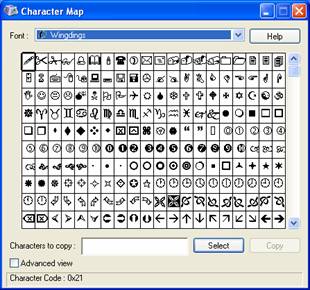
Figure 2-m. A sample of the Wingdings characters
Tutorial 2-3. Using Wingdings Font to Display a Book Icon.
Let’s walk through an example of how to add a picture of a book to the report.
1. Open the Character Map application on Windows XP, select Start | All Programs | Accessories | System Tools | Character Map.
2. Choose the font Wingdings.
3. Look through at the first row and find the picture of a book. It should be the sixth picture on the left.
4. Double-Click on the book picture (that makes it appear at the bottom) and click the Copy button. It has been saved to the Clipboard’s memory.
5. Go into the Crystal Reports’ designer and add a new text object. This puts you in edit mode.
6. Press Ctl-V to paste the picture into the text box. You should see the picture of the book in the text object.
In Chapter 5 we’ll look at how to use formulas to display checkboxes.
The Chart Object
The Chart object lets you add a chart to your report. There are a variety of options to choose from so that you can customize however you need to. There is so much to cover with this object that it was given a separate chapter. See Chapter 10 for more information.
The OLE Object
The OLE object lets you embed objects inside of your report. Some examples are embedding Word documents or Excel spreadsheets.
The Special Field Object
The Special Field object is used for printing all report-related information. For example, it can print the current page number or the total number of pages. Since there isn't a way for you to calculate this information yourself, this field was created as a catch-all for all the miscellaneous types of report information that you need. Table 2-3 lists the available fields and what they mean. These fields are treated the same as a database field object. They can be added to the report by themselves, or included in a textbox object. They also have all the same formatting options that were described in the Formatting Strings section.
Table 2-3. Special Fields.
|
Special Field |
Description |
|
DataDate |
The date when the report was last refreshed. |
|
DataTime |
The time when the report was last refreshed. |
|
FileAuthor |
The file author that is stored with the report. |
|
FileCreationDate |
The date when the report was created. |
|
Filename |
The report's file name. |
|
GroupNumber |
The current group number. |
|
GroupSelection |
The group selection formula. |
|
ModificationDate |
The date the report was last modified. |
|
ModificationTime |
The time the report was last modified. |
|
PageNofM |
Prints
"Page X of Y". |
|
PageNumber |
The current page number. |
|
PrintDate |
The date the report was printed. |
|
PrintTime |
The time the report was printed. |
|
RecordNumber |
The current record number. |
|
RecordSelection |
The record selection formula. |
|
ReportComments |
The report comments that are stored with the report. |
|
ReportTitle |
The report title. |
|
TotalPageCount |
The total number of pages. |
Moving and Sizing Report Objects
Even though we all wish our reports were perfect the first time through, unfortunately this is rarely the case. After adding objects to the designer, you frequently need to reposition objects and change their size. An earlier section of this chapter showed you how to add report object to the designer. This section shows you the details of how to manage objects within the report designer.
If you have an existing control that you want to reuse so that you don’t have to redo its formatting, you can click on it and copy and paste it. This creates a copy that is attached to your pointer and will move around as you move your mouse. When you have it positioned properly, click the mouse button to drop it there. You can also select multiple objects for copy and paste.
Selecting multiple objects is done by holding down the control or shift key and clicking on the individual controls. You can also draw a temporary window on the report and any controls that are included in the window get selected. Do this by holding down the mouse button and moving the mouse to enlarge the box. Let go of the mouse when the box is complete and any object that is fully or partially within the box gets selected.
There is a strange behavior to be aware of when selecting multiple objects using the window technique. You can't draw a window if another object is already selected. You have to first click on an empty portion of the report designer to unselect the current object and then you can draw the box. For example, assume that you selected a textbox object and then you decided that you really wanted to select multiple textboxes instead. So you click elsewhere on the report and attempt to draw a window. Unfortunately, nothing will happen. It only results in the textbox getting unselected. You need to click the mouse a second time to start drawing the window.
Resizing a control is done by first clicking on it to highlight it. This creates little dark squares in the corners of the object and in the middle sections. These are sizing handle that can be clicked on and dragged around. Position the mouse over one of the sizing handles and click the mouse button to drag the handle to the new position. Let go of the mouse button to release the handles when you are finished.
When resizing multiple objects, the sizing handles only appear on the last control selected. As you resize the last control, its new size dynamically changes as you move your mouse. The other controls will not change until you release the mouse button. At that point they all “snap” into their new shape.
There are times when you have a lot of different sized objects on the report and you need them all to be the same size. This often happens after using the report wizard to create the first draft of a report and it puts the objects on the report for you. You have to go back and adjust their position and size to make the report look they way you want it to. You can have Crystal Reports adjust the size and position of all the objects to be consistent with each other. Do this by selecting all the objects and then right-clicking on the main one and select the Size menu option. From there you can choose Same Width, Same Height, or Same Size. The objects will be resized to match the object that you right-clicked on.
When moving objects around the report, it can be helpful to display the grid lines. This makes it easier to line up objects with each other. Turning the grid lines feature on or off is controlled by changing the designer properties. Right click on the report and select Designer | Default Settings.
An alternative for doing precise adjustments to an object is to use the keyboard instead of the mouse. Due to the design of a mouse ball, it can sometimes be hard to move the mouse a very small distance without it jumping around a bit.[4] Instead of using the mouse, use the keyboard to change an object. By pressing down the Control key and hitting the arrow buttons, the object moves in the direction of the arrow. Pressing down the Shift key and hitting the arrow buttons adjusts the right side and bottom edge of the object. You can make the object larger or smaller in all directions.
When placing objects that should all line up either horizontally or vertically, it can be difficult to make sure the all line up along the exact same axis. Crystal Reports allows very precise placement of objects and this means that it objects can easily be one or two pixels off. You have to tweak it with your mouse to make sure they line up exactly. The Snap To Grid option makes this much easier because it makes sure that as long as you come close to lining one object next to the other then they will both land on the same grid marker.
If you are working on a report with multiple sections, then lining up columns can be trickier even with the help of the grid points. It gets harder to judge the exact location and width of different objects if they are in different sections of the page. Crystal Reports gives you a few different ways to help you make sure that the appropriate objects are lined up with each other. They are the alignment markers and the functions on the alignment menu.
Alignment markers are temporary transparent lines that extend both horizontally and vertically from the edges of the object to the page perimeter. They make it easy to see which objects have the same alignment. They only appear when you click on the object and hold down the mouse. Once you release the mouse the lines disappear. You can even move the object around and the lines stay visible until you release the mouse. This is probably best understood with a picture. See Figure 2-j.
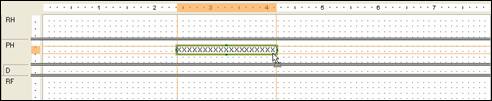
Figure 2-j. Alignment markers make it easy to align objects.
The object in Figure 2-j has the border emphasized and each border has thinner lines extending past it in every direction. This makes it easy to see exactly where the object is along the ruler markers, but you can also see which objects have the same alignment. It becomes easy to add an object to the Page Header section and position it so that it is in exact alignment with an object in the Page Footer.
Even though the alignment markers are helpful when adding new objects to the report, they are only really useful for working with single objects. Sometimes you have a report with multiple objects along the same column and you need a quick way to get them all to be aligned. The Alignment menu options give you many options for multiple aligning objects. You can select multiple objects and set them to all line up along their right edge, their left edge, the top border and many other ways.
To align multiple objects, select the group of objects that need to be aligned. Once the objects are selected, right-click above the one of the objects and select the menu option Align. This presents a sub-menu of the different ways to align the objects. There are eight ways in total and each is self-explanatory.
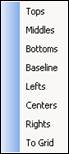
A key part to remember is that the “anchor” object is the object that the mouse was hovering over when you did the right-click. What this means is that when you tell the program to align all the objects along the Top for example, the program needs to know which object should be used as the basis for aligning all the other objects up to it. The “anchor” object is the object that you right-clicked on after they were all selected. If you make the mistake of right-clicking on an area of the report where there isn’t an object, then the grouping is reset and you have to start all over again. So be careful where you right-click!
Moving objects with Guidelines
The last section discussed how to add objects so that they lined up with existing objects. But it didn’t cover how to move multiple objects so that they stay lined up. That’s where Guidelines become useful.
Guidelines create an anchor for attaching objects. The benefit is that anytime you move the guideline all the objects attached to it also move. If you have a multi-column report with many columns and you have to insert a new column, it can be difficult to move all objects over to make room for the new column. But if you anchor all the objects in a column to a guideline then you can move the guideline and all the objects move with it. You can move entire rows and columns of fields trouble-free without losing alignment.
Guidelines are inserted into a report by clicking on either of the rulers. A small triangle appears to represent where the guideline is. You can see in Figure 2-k that there is an example of a guideline on each ruler. If you added guidelines to your report and they aren’t visible, select the menu option File | Options | Layout Tab to check that the Guidelines option is enabled.
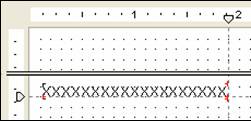
Figure 2-j. Guidelines on the ruler.
Once a guideline has been added, you can attach objects to it. Drag an object so that one of the edges lines up with the guideline. This automatically attaches the object. Objects can also be attached at the center points. A small red marker appears in the corners of the object along the edge that is attached. This makes it easy to see which objects are attached to which guidelines. Do this for all the objects in a row or column that need to stay aligned while being moved around.
Be careful when moving guidelines to make sure that your mouse stays within the ruler’s region. Personally, I have a strange habit of accidentally moving my mouse out of the ruler region and this makes the guideline disappear. Hence, if you deliberately want to remove a guideline then just click on it a drag it off the ruler. If you did this by mistake, press Ctrl-Z to undo the action and the guideline appears back on the ruler.
One thing to be aware of is that even though you can move a guideline and it takes the objects with it, it doesn’t work the other way around. You can’t move and object that is attached to a guideline and expect the guideline to move with the object. Instead, the object becomes unattached from the guideline and moves around independently.